Some sort of sanity returned to volatility driven U.S stocks in the past week with the traders seeing the calmest period for the benchmark S&P 500 in three months, which did not post a move greater than 1% in either direction during any day. Will take a detailed look at the chart later. The Cryptos on the other hand came under renewed selling pressure giving up all the gains from the previous week. On the Forex front, Greenback is finally beginning to buckle as evident from the Dollar Index chart – the current rally in USD seems to have taken a pause for now. Let’s see some weekly numbers for financial markets before moving on.
The Cryptocurrencies could not sustain the gains from the previous week & fell sharply. Considering the recent correlation with the stocks, the move makes sense but certainly not for Crypto bulls who have seen the digital assets give up their gains for the umpteenth time. Bitcoin was unable to hold on to the psychological barrier of $4K as the support once again turned to resistance (hourly chart below). BTC price is hovering around the $3700 at the time of writing with the immediate resistance zone lying in the $3800-$3850 region. The immediate bias is bearish as long as this resistance is not surpassed. BTC dominance was sitting @ 52.4% with a total market cap of $122 at the time of publishing. The digital coins are at a critical juncture as we move closer to the launch of ICE’s physical Bitcoin futures & more importantly U.S SEC’s decision on a Bitcoin ETF.
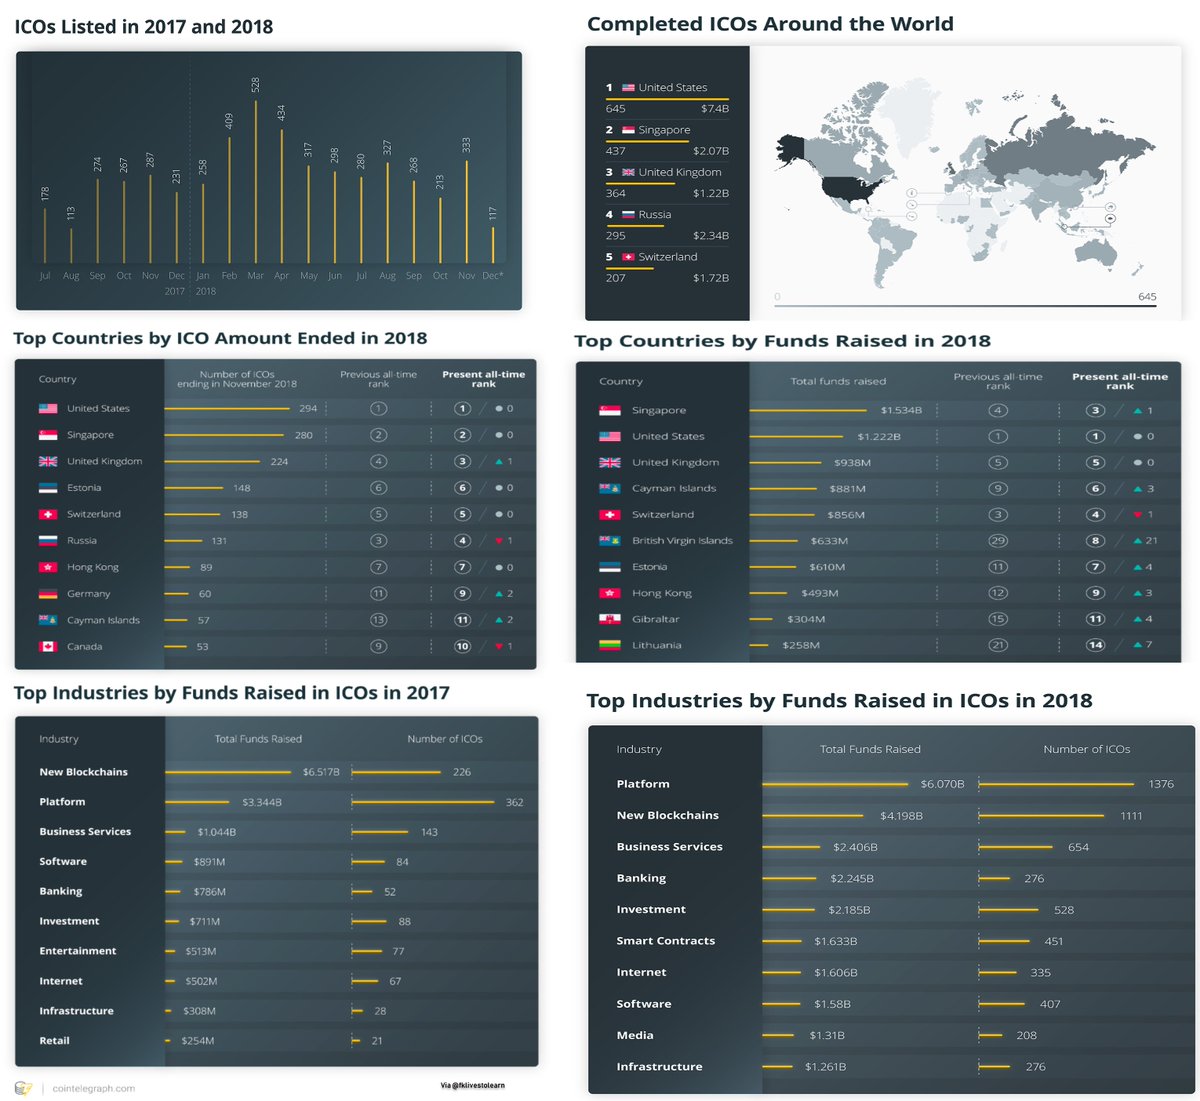
A couple of other interesting developments in the Cryptoverse included a reported 51% attack on Ethereum Classic & a report from the Bank of International Settlements (BIS). While the former acted just like any other bad news, the latter suggested that 70% of the banks polled were actively looking into the possibility of issuing CBDCs (Central bank digital currencies). However, an overwhelming 85% said they are not yet convinced that the costs associated with launching such a project would outweigh the benefits. One of the most active projects in this regard is being taken by up Sweden’s Central bank which has been working on “e-krona” since 2017. And finally, here are some ICO stats compiled by Coin telegraph for 2017-2018. The report shows that although the ICO activity slowed down significantly in 2018 as compared to 2017, it was still much higher than the previous years.

Although the U.S stocks closed Friday on a weaker note, the major indexes closer solidly higher – Dow rose 2.4%, S&P 500 added 2.5% & Nasdaq jumped 3.5%. The dovish tones from the Fed. speakers sparked confidence in the investors as they picked up stocks at discounted prices. The confidence from U.S-China trade talks to hammer out their tariffs dispute also helped sustain the rally. On the downside, a lot of the pundits are also of the opinion that cyclical factors are more in play than the temporary boosting factors. Although a temporary problem, the continued U.S government shutdown might also become something of drag if it doesn’t get resolved soon. On the data side, China plans to set a lower economic growth target of 6.0-6.5% in 2019 than the previously anticipated number of over 6.5% renewing fears of an economic slowdown in the World’s second largest economy.
Looking at the S&P 500 chart, it has continued to inch up from the lows carved out Pre Christmas last year. The price is sitting right on top of the resistance around 2600. A break here would alleviate the strong bearish undertone as the index move enters a more bullish consolidation towards the previous high. The RSI has climbed to over 50 from the oversold territory signifying the current constructive move. The most noticeable factor was the drop in volatility evident from the ATR (Average true range) slip. All will depend whether this price level is sustained at this resistance level next week.

The second biggest story was the rebound in Crude Oil prices owing to the positive sentiment in Equity markets. Having said that, it could only be a technical rebound in the larger MT bearish move, as the prices weakened after hitting the ST resistance level of $53.00 to close @ $51.59. On a side note, long-delayed Aramco (ARMCO) IPO by Saudia Arabia is being planned for a lunch in 2021 after undertaking a series of moves to increase transparency for potential investors. The move included the results of an independent audit that confirmed that the kingdom had proven Oil reserves of 260 billion barrels & also announced the issuance of bonds by the company next quarter. I wonder how successful with that be as the World moves to more sustainable & renewable initiatives?
Most of the USD Majors have recovered handsomely from the losses incurred after the Flash crash last week. In fact, they have reversed ST trends to end the week. Positive sentiment in Equities also helped the risk currencies gain some traction. The Dollar Index chart carved out a new low after breaking the immediate support of 96.00, now turned resistance. DXY has entered a consolidation zone with a top in place around 97.60. Further weakness towards the major support of 94.00 is possible, which needs to hold to expect a return to the bullish trend. A break of the support, however, would signal the start of a new bearish trend. GBPUSD will be on watch next week as the Brexit vote takes place in the British Parliament on Jan. 15. It would be a deal breaker for the pair which closed trading above the 1.2800 mark. For the economic data, Japan, U.K & Canada announce their CPI’s while U.S would release the Advance retail sales & U. of Michigan sentiment reports.
Winding it off here on a lighter note as usual… What do you think?
Email?| Twitter? | LinkedIn?| StockTwits? | Telegram?


