For several years now, my focus has been on using alternative data of many kinds to predict macroeconomic statistics. When ran the Futures Group for the PDT Group at Morgan Stanley in the 1990’s I became a data omnivore and a data pack rat, taking everything I could find and storing it in case it became a useful predictor of the things we cared about. In that era, my focus was on fairly short-term price movements (daily or higher frequency), but over the last decade I’ve come to focus on longer term, more fundamental, prediction. My approach, when I find a dataset, is not to download it once for an ad hoc analysis but, always, to build a system that streams it regularly into a well-organized database.
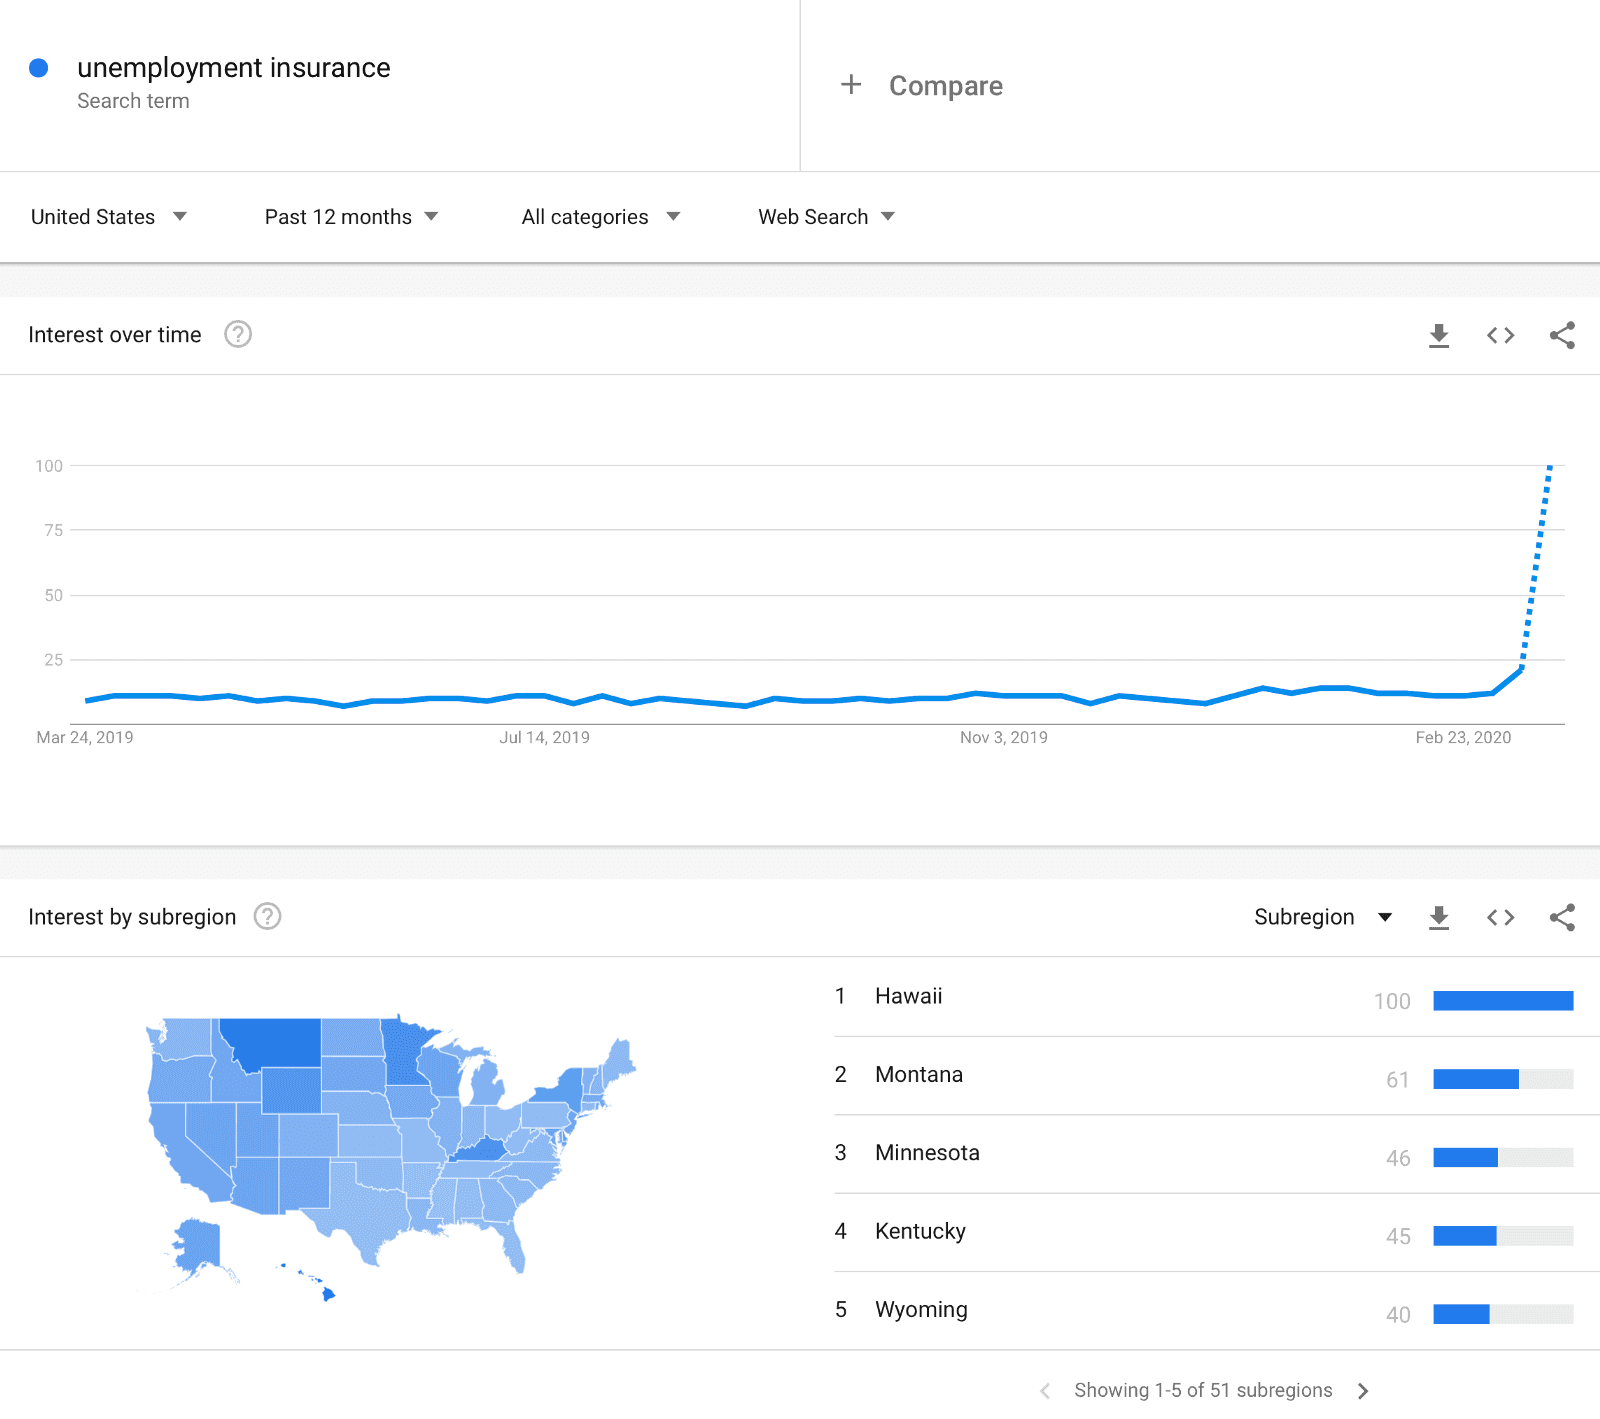
Many commentators have noted that there is a current spike in Google searches for terms like “unemployment insurance” as we enter an economic environment when jobs are at risk. Google Trends is a website that allows the user to look at how search volumes are changing.

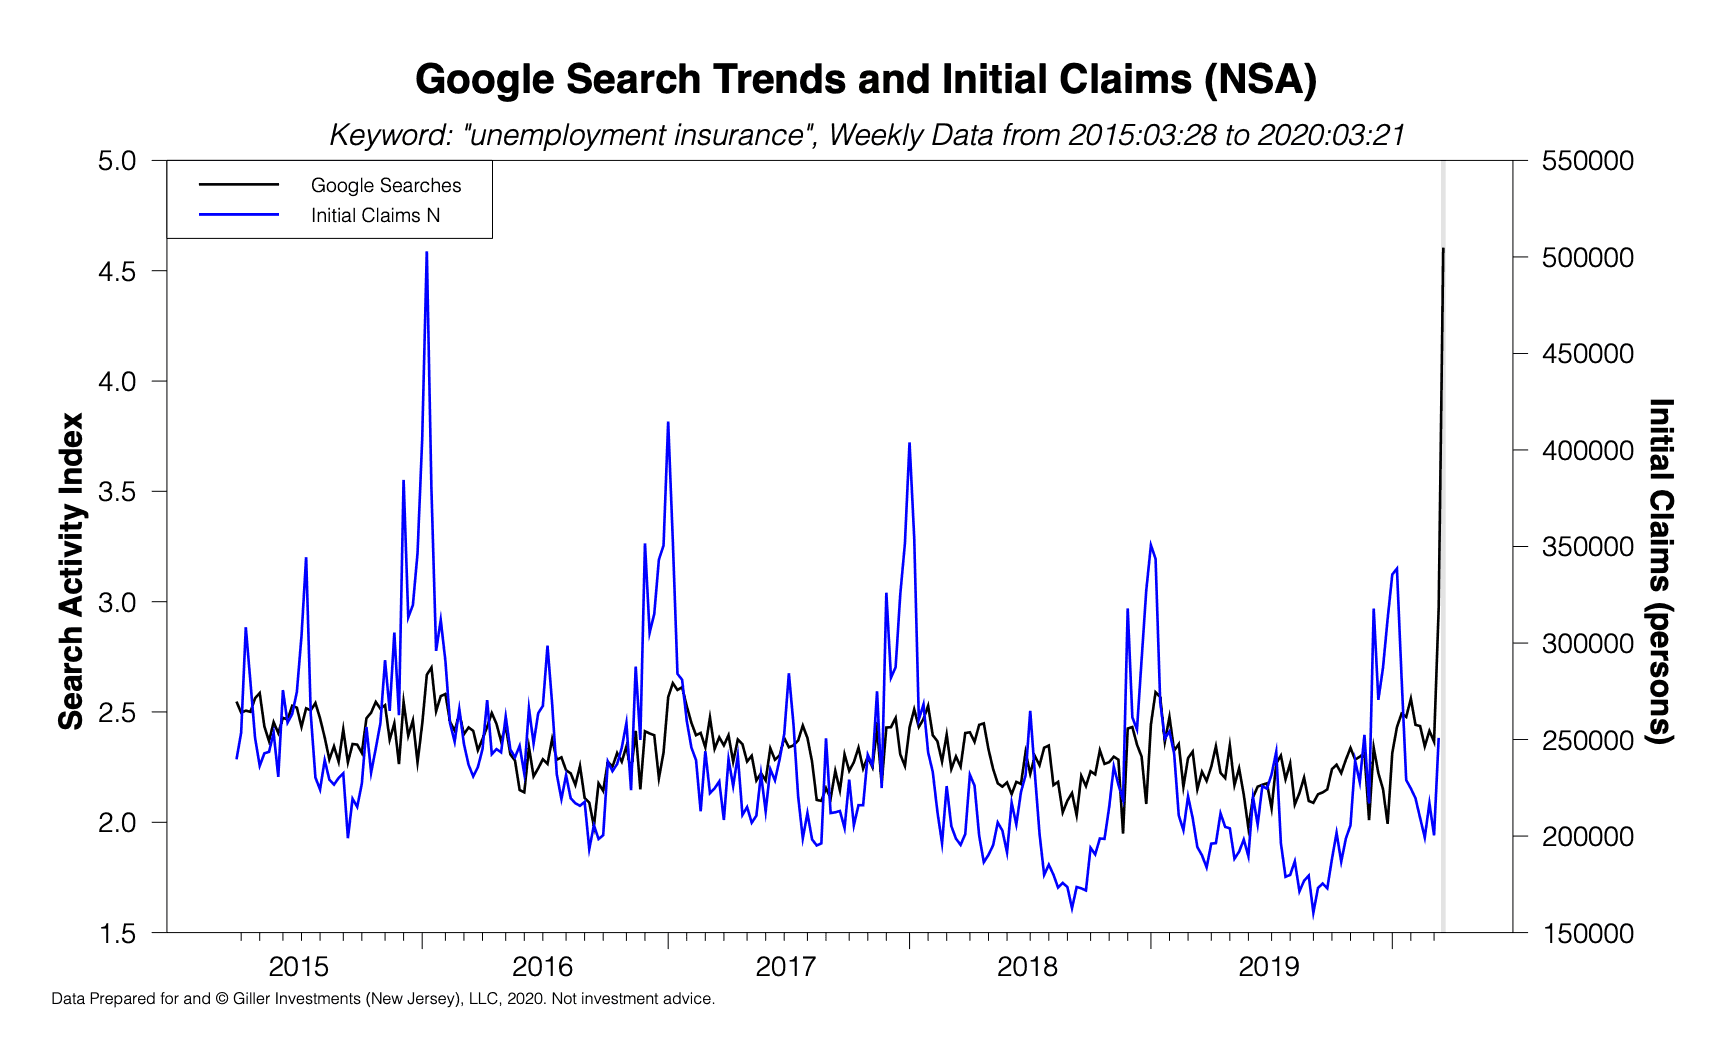
As can be clearly seen from the above screenshot, search trends are breaking out. It would be nice if that could be literally transformed into a predictor of Initial Claims, but Google do a lot of processing on the data they release — it is far from “raw” data — and so we need to use an algorithm to relate it to real metrics of the economy.

The simplest “algorithm” is linear regression, but in my experience that rarely does a good job on macroeconomic data because the relationships between variables tends to shift through time (the relationships are non-stationary). For example, using ordinary least squares on the above data gives a prediction of 407,350 for the most recently released data (for the week ending 03/14/2020) when the released datum was 250,892. This is a massive error!
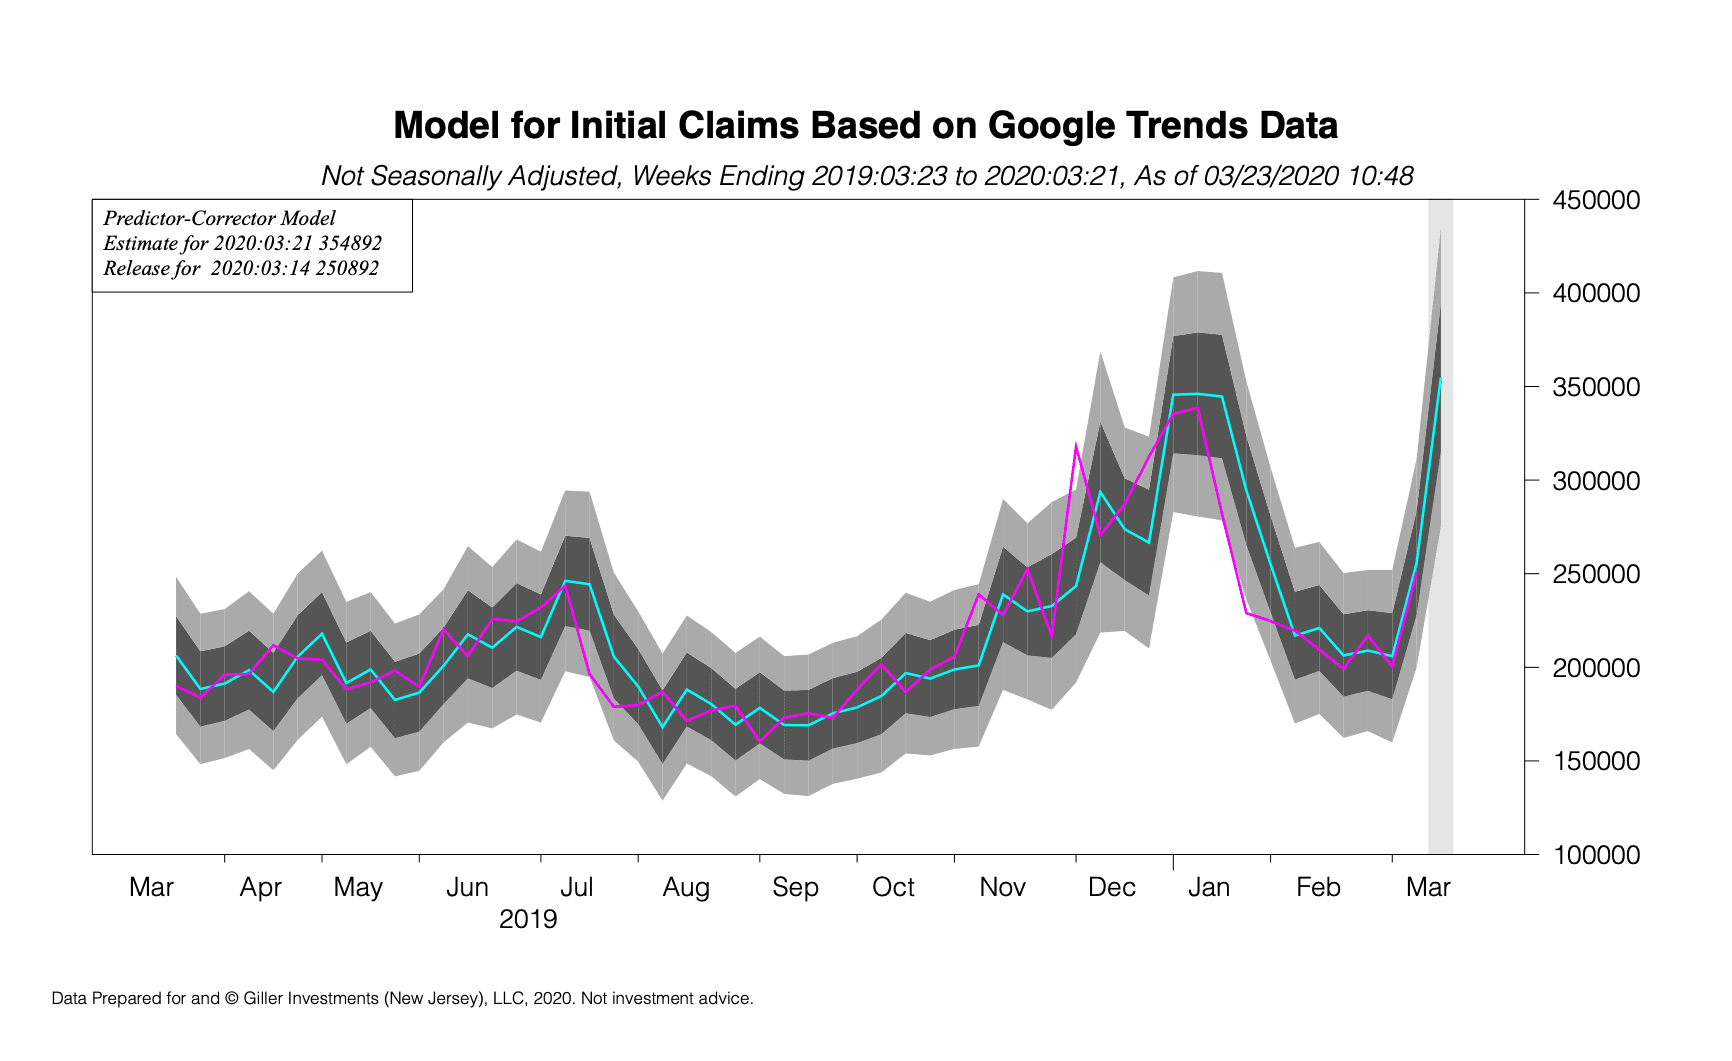
Instead of linear regression, I tend to implement predictor-corrector machine learning algorithms. These are models that assume that there is a useful relationship between variables but that relationship tends to evolve through time. The algorithm starts off making naive predictions (it usually starts off by assuming the initial relationship is that this period’s data should equal the prior period’s data — technically this is known as a “Martingale” model) but observes its own errors through time and learns how to correct them. This is very similar to the way a child might learn how to predict the trajectory of a ball in flight so that they can catch it (without having to learn calculus and Newton’s laws of motion).

Using this kind of model gives a much better prediction, and for last week’s release we had 241,589. I always accompany my predictions with a confidence region, because there is always uncertainty in forecasting and the right approach is to quantify that uncertainty, and the prediction lies well within the confidence region for the history presented.
I have set up automated procedures to run this model and hope to be able to publish its results on an ongoing basis on AWS Data Exchange for a small fee.


Nice