The fraudster’s greatest liability is the certainty that the fraud is too clever to be detected. — Louis J. Freeh
The fact is that fraudulent transactions are rare; they represent a diminutive fraction of activity within an organization. The challenge is that a miniature percentage of activity can quickly turn into big financial losses without the right systems and tools in place. Criminals are deceitful and frequently change their tactics. This publications highlights how advances in fraud analytics, systems can learn, adapt and uncover emerging patterns for preventing fraud.
What is Anomaly Detection

Anomaly detection is a technique used to identify unusual patterns that do not conform to expected behavior, called outliers. It has various application from spotting a malignant tumor in an MRI scan, identifying hack signals down to fraud detection in credit card transactions.
What Are Anomalies?
In data mining, anomaly detection is the identification of rare events or observations which raises question marks by differing significantly from the majority of the data. Anomalies can be broadly categorized as:
- Point anomalies: A single instance of data is anomalous if it’s too far off from the rest. A typical example would be detecting credit card fraud based on expenditure.
2. Contextual anomalies: The abnormality is context-specific and is customary in time-series data. A viable example would be spending $150 on food every day during the holiday season is reasonable, but may be odd otherwise.
3. Collective anomalies: A set of data instances collectively helps in detecting anomalies. An example would be an unexpected copying files from a database may be flagged as a potential cyber attack.
Anomaly detection is similar to — but not the same as — noise removal and novelty detection.
Anomaly Detection Techniques
1. Simple Statistical Methods
The simplest approach to identifying irregularities in data is to flag the data points that deviate from common statistical properties of distribution, including mean, median, mode, and quantiles.
Challenges with Simple Statistical Methods
The data contains noise which might be similar to abnormal behavior because the boundary between normal and abnormal behavior is often not precise.
- The definition of abnormal or normal may frequently change, as malicious adversaries constantly adapt themselves. Therefore, the threshold based on the moving average may not always apply.
- The pattern is based on seasonality. This involves more sophisticated methods, such as decomposing the data into multiple trends in order to identify the change in seasonality.
2. Machine Learning Methods

Thus is the application of artificial intelligence (AI) to provide the systems with the ability to automatically learn and improve from experience to detect these anomalies. The motivation behind using Machine Learning in fraud detection is because of two major reasons.
- Speed
- Adaptability
Machines are fundamentally more capable of quickly detecting patterns compared to humans. Also, as fraudsters change their tactics, machines can learn the new patterns much quicker.
There are numerous machine learning techniques to use but for the context of this article, we will be using Catboost Algorithm.
What is CATBOOST?

CatBoost is an algorithm for gradient boosting on decision trees. It is developed by Yandex researchers and engineers, and is used for search, recommendation systems, personal assistant, self-driving cars, weather prediction and many other tasks at Yandex and in other companies, including CERN, Cloudflare, Careem taxi. It is in open-source and can be used by anyone.
Why CATBOOST?
The library is laser focused on
- Great quality without parameter tuning: Reduce time spent on parameter tuning, because CatBoost provides great results with default parameters.
- Improved accuracy: Reduce overfitting when constructing your models with a novel gradient-boosting scheme.
- Fast Predictions: Apply your trained model quickly and efficiently even to latency-critical tasks using CatBoost’s model applier.
- Fast and scalable GPU version: Train your model on a fast implementation of gradient-boosting algorithm for GPU. Use a multi-card configuration for large datasets.
- Categorical features support: Improve your training results with CatBoost that allows you to use non-numeric factors, instead of having to pre-process your data or spend time and effort turning it to numbers.
CATBOOST Installation
Installation is only supported by the 64-bit version of Python. It mainly has two dependencies Numpy and Six. It can be installed by the two popular Python Package managers — Conda and PyPI
Conda installation:
conda install catboost
PyPI installation
pip install catboost
Grab a coffee and let’s detect credit card frauds with codes
The link to the code, dataset and other resources used in this article can be found here
Import packages & reading data
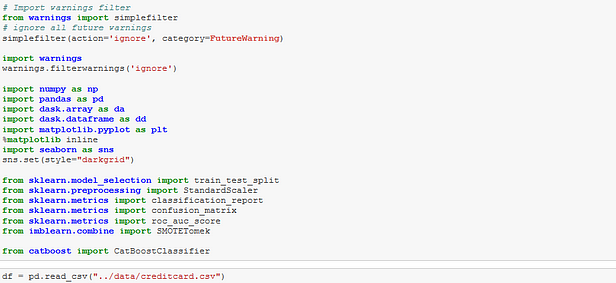
Here, we start with importing all the python libraries we would be needing for this project.
warning: Warning control for suppressing deprecated functions in python packages.pandas&numpy: For data wrangling and scientific computations respectively.dask.array&dask.dataframe: For scalability of numpy and pandasmatplotlib&seaborn: For visualizations of graphs and charts.classification_report,confusion_matrix&roc_auc_score: Performance metric and report used to evaluate the predictions.SMOTETomek: Sampling technique.train_test_split: To split the data.
In order to use dask.array and dask.dataframe, it must be installed. To install all dask packages all at once, use the following code snippet using the Conda or PyPI package managers.
# Via Conda conda install dask# Via PyPIpython -m pip install "dask[complete]" # Install everything
Exploring and preprocessing the data
This section is very crucial as we prepare and wrangle the data to gain insights.
Getting an overview of the dataset
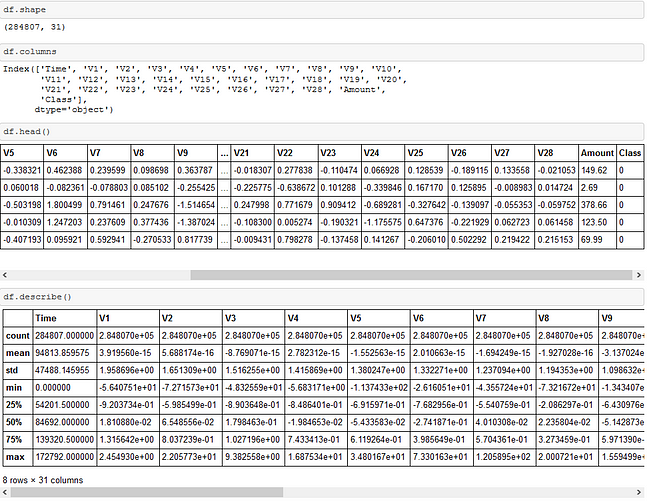
It can be observed that the datasets has 31 features. The descriptions of the dataset can be found here. Overview of the descriptive statistics of the dataset can also be studied.

Handling missing data is important as many machine learning algorithms do not support data with missing values. The dataset from the analysis does not have any missing value.
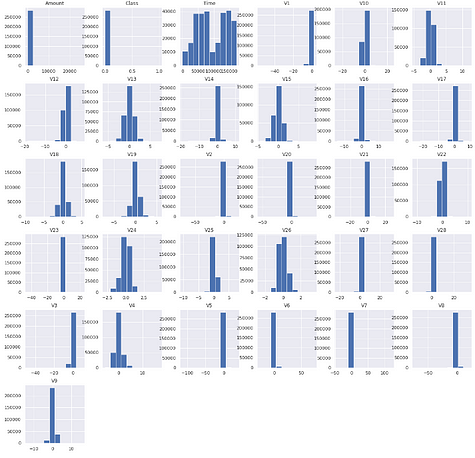
The feature distribution helps in understanding what kind of feature you are dealing with, and what values you can expect this feature to have. You’ll see if the values are centered or scattered.
![]()
In order to understand the changes between the features, a correlation matrix is important to be plotted to know variables having high and low correlation in respect to another variable.


The above correlation matrix shows that none of the V1 to V28 PCA components have any correlation to each other however if we observe Class has some form positive and negative correlations with the V components but has no correlation with Time and Amount.
Study fraudulent behaviors


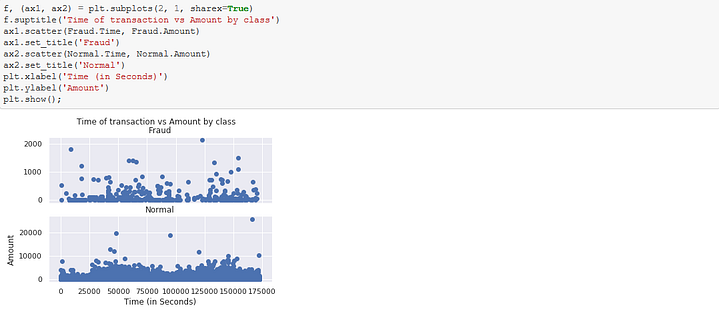

This analysis shows how infrequent and amount ranges these fraudulent activities induce.
N/B: classes 0 and 1 means not fraudulent and fraudulent respectively.
Dask Scalability
The fraud detection operation is of cardinal importance in various financial system, and to build better model, more data is required to train the machine learning models. Fraud detection is not a one-off operation so scalability is key in order to provide an efficient system over time. This is where Dask plays a huge role.

Pandas have been one of the most popular and favorite data science tools used in Python programming language for data wrangling and analysis. Pandas have their own limitations when it comes to big data due to its algorithm and local memory constraints. However, Dask is an open-source and freely available Python library. Dask provides ways to scale Pandas, Scikit-Learn, and Numpy in terms of performance and scalability. In the context of this article, the datasets is bound to be constantly increasing, making Dask the ideal tool to use.
So, in order to display these scalability and performance features, we will tunboth pandas and dask codes side by side and compare the execution time and performance in the model building phase.
Balancing the data

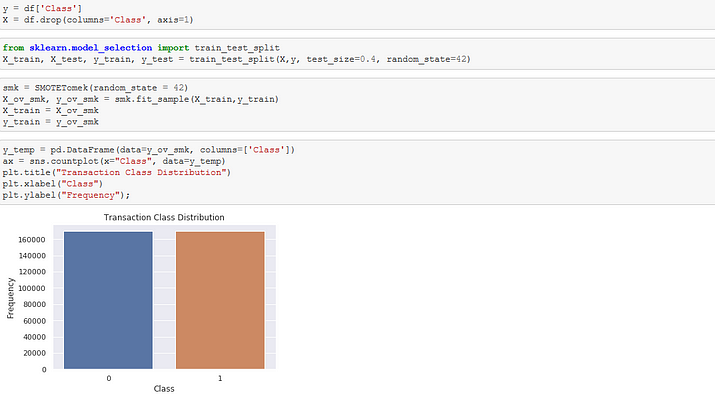
It can be observed that the dataset distribution of the Class feature is highly imbalanced. In this situation, the predictive model developed using conventional machine learning algorithms could be biased and inaccurate. Two basic approaches to handle this situation is via:
- Under-sampling
- Over-sampling
For the context of this publication, the SMOTETomek oversampling technique will be utilized. It is cautious to note that to avoid data leakage that the sampling technique used should be applied to the training section of the data.
For Pandas:
For Dask:

Feature Scaling
This is an important step in data preprocessing to normalise the data within a particular range. Sometimes, it helps in speeding up the calculations in an algorithm.
For Pandas:

For Dask:

Model Fitting
The training data here is fitted to an already tuned Catboost model. This step is an iterative process and its time expensive. Here, we will time the execution time using datetime .
For Pandas:


For Dask:
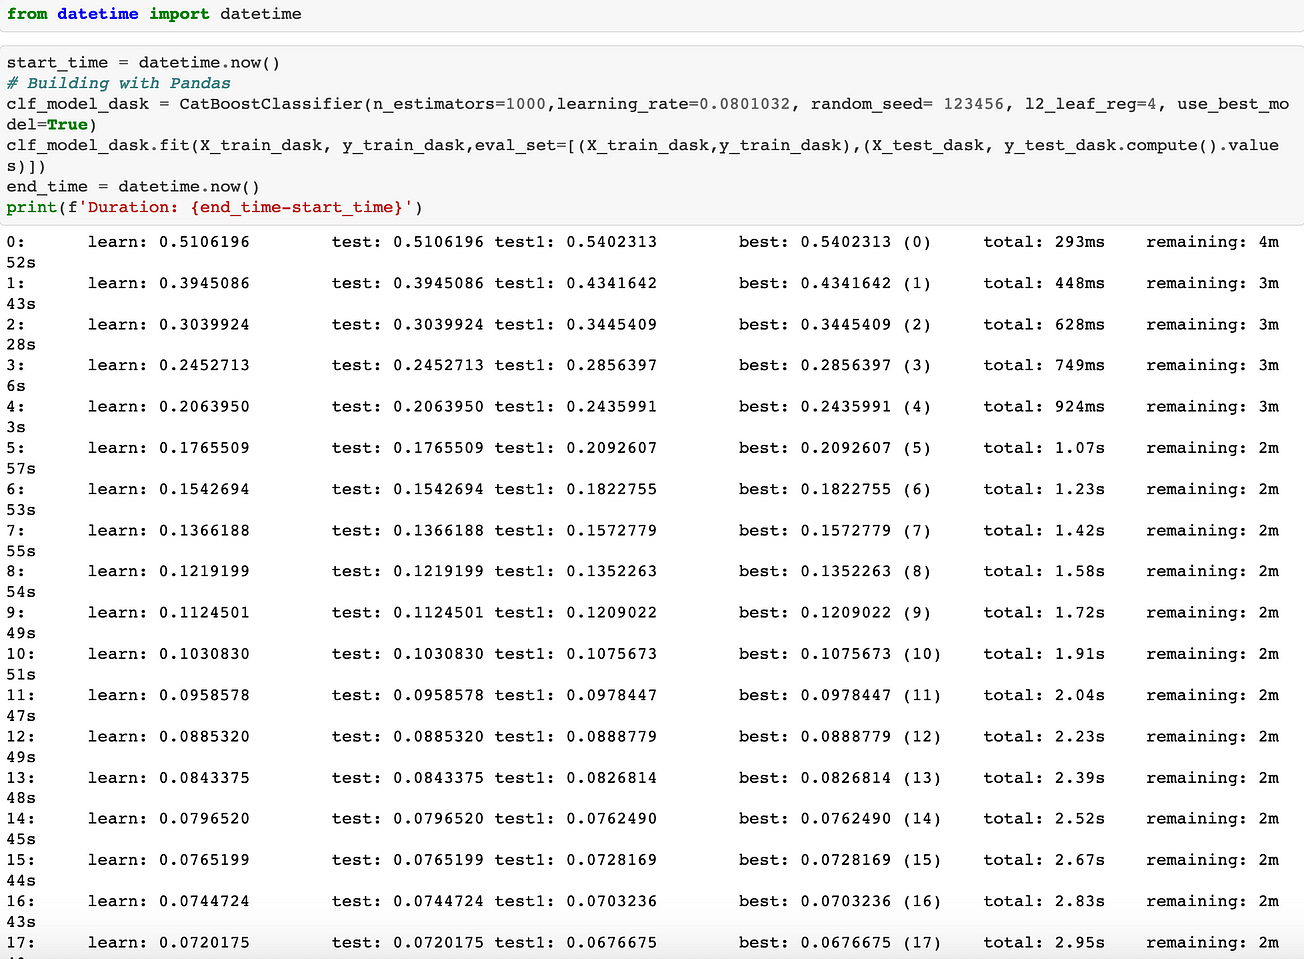

It is evident that Dask has a quicker execution time of approximately 3 minutes 57 seconds against Pandas execution time of approximately 4 minutes 44 seconds. Note the parameters used for execution were constant during the comparison.
Predictions and Evaluation
For Pandas

For Dask
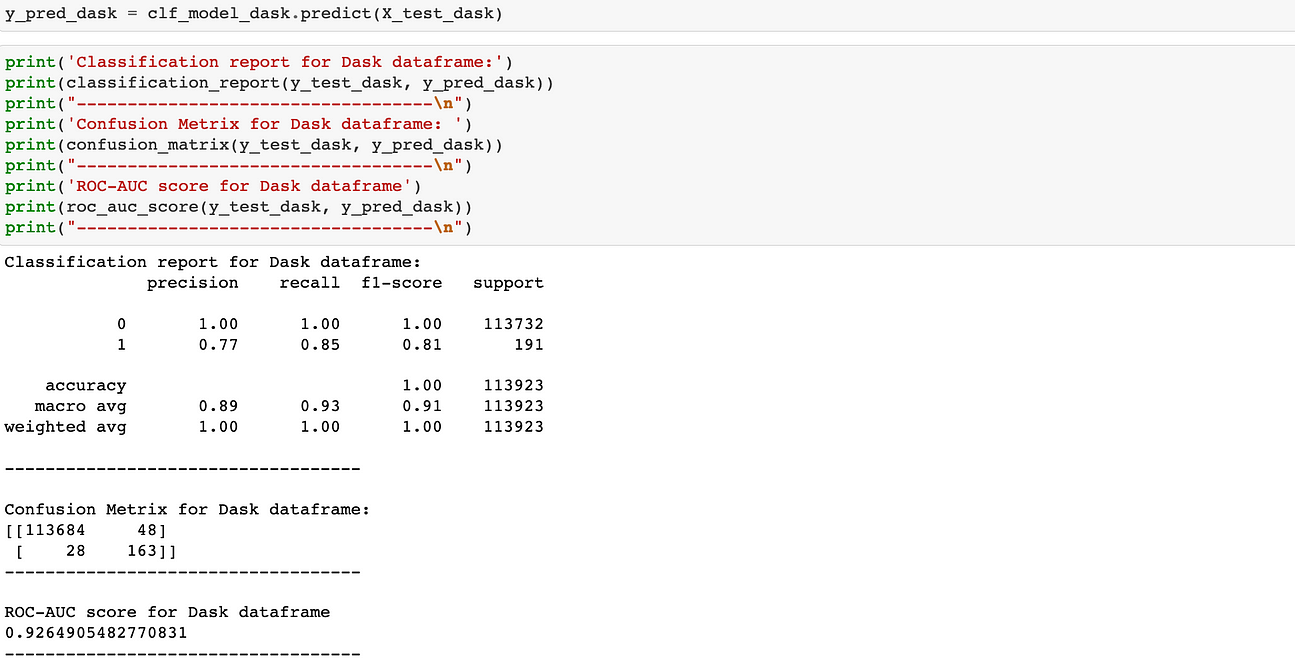
It can be observed the model performance quite similar for both dataframes as it has excellent scores across precision, recall, f1-score and roc-auc_score.
I hope this article will highlight how fraud analytics and machine can be utilized to fight against credit card frauds. Thank you for reading.

