Venture Capital market analysis from the Great Recession to COVID19
When analyzing a startup, especially the ones at early-stage, investors focus on three main factors: team, market and product. Times of crisis don’t make an extraordinary entrepreneur less capable, and a product does not lose its technical quality. Therefore, the main variable changing and consequently impacting the investments and valuations is the market.
The current scenario still presents a lot of uncertainty, markets that have always been large may decline drastically, while segments that until then were not relevant can gain strength. In this article, we will explore data from the Venture Capital market, in order to infer changes that are probable to happen.
1. Great Recession
In this step, we will explore startups’ transactions¹ located in the US during the Great Recession period.
1.1. Number of Transactions and the Total Amount Invested Between 2006 and 2011
The 2008 crisis did not impact the number of Seed transactions, which grew significantly in the period. The other rounds decreased in 2008 and 2009, starting to regain growth only in 2010.


The goal of a startup is to go public or be acquired by a large company for a good valuation. In this way, the changes generated by a crisis impact the publicly-traded and decrease the chances, especially for late-stage startups, of a successful liquidity event. In this context, I believe that Seed investments become more attractive since the long investment horizon collaborates with the expectation of improvement in market conditions.
When looking at the volume invested, we realize that the representativeness of the Seed rounds, despite having grown in the middle of a crisis, is still very small. Thus, the growth of Seed investments can be understood as an alternative for Venture Capital funds, to continue the search for opportunities, discarding the need for a capital call.
All rounds starting from Series A suffered a strong reduction, mainly noticed in 2009, since the first half of 2008 was able to guarantee good investments for the year. It is also possible to note that even in 2011, the volume invested in certain rounds did not reach the level observed in 2007.
1.2. Rounds Size Between 2006 and 2011
The median size of the round fell in 2009, regardless of the classification of the transaction, in which Seed investments showed the biggest drop. For the early-stage and late-stage, the interquartile range has changed little, but the acute drop in the number of transactions has resulted in a decrease in the total amount invested in the period.


We saw that, in general, the crisis reduced both the number of transactions and the size of the rounds.

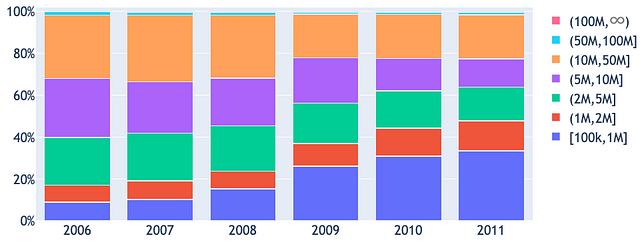
In the graph below, transactions were segmented into some groups, based on the total amount invested. Investments of up to USD 2M gained importance after 2008, surpassing 50% in 2010 and 2011. This increase is the result of the bigger number of Seed transactions and size drop of Series A rounds.
The sample used does not include valuation data, so it’s impossible to identify the exact number of down rounds. However, we managed to get a close idea by looking at the number of startups that raised new rounds with a smaller size than on previous rounds. An infrequent situation, which most often occurs when the startup is in need of cash and cannot find investors to support a bigger transaction. The difficulty in raising capital results in valuations less than or equal to the last round
This adverse scenario results in companies looking for bridge rounds, when investors from the last round make a new contribution, typically at the same valuation, with the purpose of giving some oxygen to the startup’s cash flow and avoiding a write-off. When it doesn’t happen, the startup is obliged to accept smaller investments at a lower evaluation. Furthermore, many don’t get to obtain new contributions, even with unfavorable terms, being then forced to cut their costs and, in many cases, leading to the death of the company.

Thus, a round size reduction, although not being conclusive, may indicate that the value of the startup was less than or equal to that of the last investment round.
The chart on the side indicates the percentage of rounds, in which the total amount collected was less than the last transaction. We can notice that the worst scenario occurred for startups that raised subsequent rounds in 2007 and 2009. In this group, 53% of startups raised, in 2009, a lower value than what was raised in 2007.
1.3. Valuations Between 2006 and 2011
The value of a startup is a combination of objective and subjective factors, but the general dynamic is summarized as follows: the startup decides the amount of capital needed to achieve its short and medium-term plans, the valuation ends up being a consequence of round size and expected dilution. By accepting a certain amount, the investor believes that the company will be able to deliver enough progress to raise on a new round (or be acquired) at a higher valuation than the current one.
In times of crisis, liquidity events decrease and publicly traded companies are priced at lower levels. Thus, late-stage investors adjust the valuations in a manner consistent with what the financial market is paying for public listed companies. The other investors, seeking to preserve their return, also reduce the valuation they are willing to pay
In practice, the process of adjusting return expectations is slow and often only affects late-stage rounds. In this way, the Venture Capital industry becomes less susceptible to fluctuations in the capital market, but deep crises such as the Great Recession and COVID-19 tend to affect this market as well.
In adverse times, many LPs start to avoid illiquid and high-risk investments, while others see good opportunities in other assets, such as the stock market. In the crisis, it is difficult to see new Venture Capital funds, and the already capitalized ones invest more cautiously. This results in entrepreneurs with difficulty creating competition for the investment round, which is one of the main reasons for the increase in valuations.
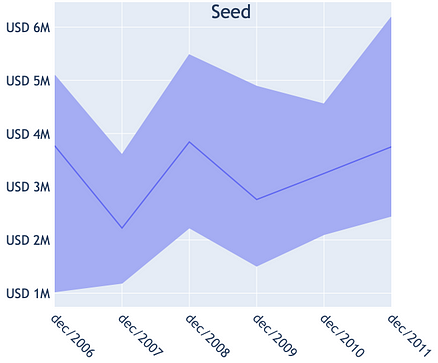
As the valuation information is not available on Crunchbase used the estimates made by Pitch Book² to visualize what happened during the 2008 crisis. A drop is noticeable, especially in the early-stage and late-stage rounds, in which the full recovery occurred only in 2011. The valuation of Seed transactions, despite having decreased in 2009, was already fluctuating before the crisis.


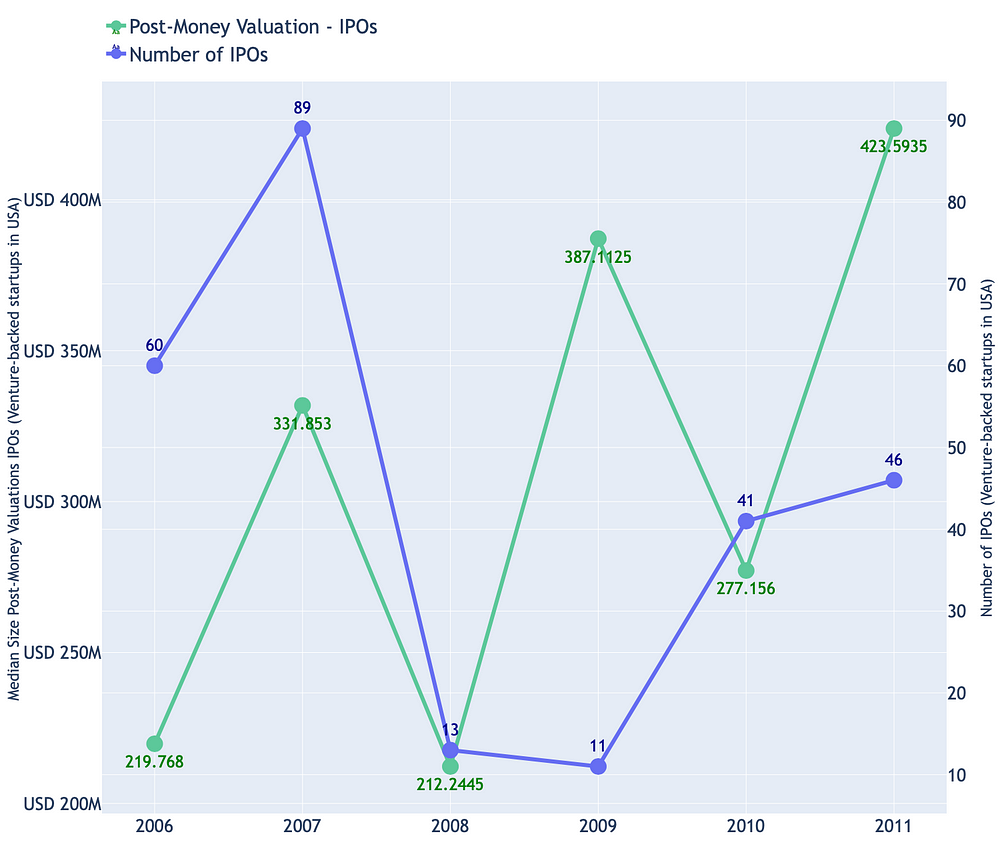
Liquidity events are the main way for a Venture Capitalist to manage expectations. The number of IPOs fell from 89 in 2007 to 13 in 2008, and remained below the observed point before the crisis, even in 2011. The year 2009 suggests a strong recovery in the valuation of IPOs, however, with only 11 transactions, the median it’s not enough to infer an improvement.


The number of acquisitions fell slightly in 2008 and 2009, while the median of valuations fell by half, suggesting that capitalized companies took advantage of the crisis, to acquire for lower prices startups facing cash flow difficulties. These acquisitions usually focus on technology and the team (acqui-hire), with the goal of accelerating the digital transformation process of buyers. It is interesting to note that, unlike IPOs, acquisitions showed a strong recovery in 2010.
2. The US Venture Capital Market After 2010
In this step, we will explore ³ startups’ transactions located in the USA between 2011 and 2019.
2.1. Number of Transactions and the Total Amount Invested Between 2011 and 2019
After 2010, the asset investment class experienced a period of bull market. In the case of Venture Capital, this period was marked by growth, both in the number of transactions and in the total amount invested.

Late-stage rounds (Series C +) are the main cause of the increase in the total amount invested, since few transactions move a lot of capital. This phenomenon indicates that many startups are postponing a possible IPO, choosing to raise large rounds in the private market.
There are some reasons why a company remains in the private market: 1) High cost of an IPO. 2) Possibility to choose investors and keep the cap table under control. 3) It is simpler to make major changes in the company. 4) The expectation of a more prosperous capital market in the coming years.
These reasons, combined with the capital availability led by late-stage Venture Capital funds, contributed to the increase in the volume invested in the period.


The Seed rounds, despite being less representative in relation to the total capital invested, differed in the number of transactions. One of the reasons is that new Venture Capital managers typically start investing in Seed transactions, as these investments require less capital. Upon reaching satisfactory returns, new funds are launched with a focus on the other stages.
Another way of looking at the boom in the number of Seed transactions is through the drop in the cost of creating a startup⁴. Horizontal computing and the popularization of open-source software reduced costs that went from USD 5M in 1999 to USD 500k in 2005. Cloud computing, led by AWS, enabled this cost to reach USD 50K in 2010. Test an idea effectively got easier and easier, encouraging the growth of Seed rounds.
The number of Series A and Series B transactions hasn’t kept pace with Seed’s growth, indicating that many startups have not advanced to the other stages of the investment cycle, reducing the expected return on a portfolio. This scenario made many early-stage investors choose to invest in a little more mature startups, even if they had to pay higher valuations, contributing to the reversal of the upward trend in the Seed rounds after 2015.
2.2 Rounds Size Between 2011 and 2019

We noticed that after the Great Recession, rounds below USD 2M gained representativeness, a trend that continued up until 2013. The representativeness of rounds above USD 50M gained strength as of 2014, in line with the idea that startups are opting to stay in the private market for a longer period.
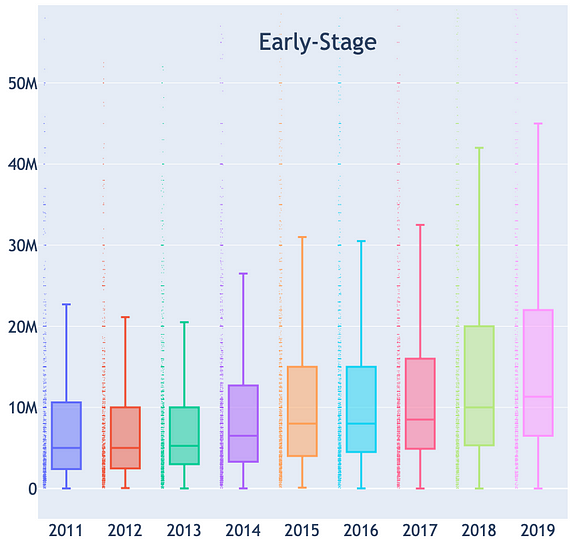
The figure below helps us to visualize the upward trend both in the median of the rounds and in the interquartile range. The increase in variability is the result of factors ranging from how capital intensive a given business model is, to macroeconomic motivations, such as low-interest rates. The increase in the rounds size is a strong indication of bigger valuations, since entrepreneurs would hardly accept aggressive dilutions in periods of heated market.


2.3. Valuations Between 2011 and 2019
As startups become successful, a success that translates into new rounds, acquisitions, and IPOs, optimistic expectations regarding the market gain strength. This scenario contributes to the valuations growth at all stages, Pitch Book⁵ estimates help us to visualize this trend.


In recent years, the Venture Capital industry has received criticism for “insane valuations”, often suggesting a bubble. We saw that the valuations in fact managed to increase, but the rate was not much different from what was observed in the US capital market. The median Pre-Money valuation in late–stage rounds grew 2.5x between 2010 and 2019, while the Nasdaq index grew 3.7x in the same period. However, if we look at the average valuations, there was a growth of about 5.7 times, which indicates the existence of outliers in the Venture Capital industry.
Often, extreme cases such as WeWork are used as a proxy for the industry’s behavior, which generates a myopic view of the sector. Many criticisms point out that the growth in valuations is the result of an extremely heated market, since such an increase is not justified by metrics, such as revenue and profitability. This situation is related to the strong influence of expectations on the evaluation of startups.
Liquidity events are crucial to align expectations, after all, they are the ones that guarantee a return. In the graphs below, we can see an increase in the Post-Money valuation of IPOs and acquisitions, however, less consistent than the observed growth in the valuations of the Venture Capital rounds.


It is difficult to conclude whether the industry is experiencing a bubble or not, but historical data shows that Venture Capital returns are not the best⁶. In 2017, the median returns for the last 10 years of the VC industry in the U.S. were 1.6 percentage points below the return generated by Nasdaq in the same period. This indicates that Venture Capital is not a good investment in terms of risk and return and, considering illiquidity, it gets even worse. So what justifies the global growth of the industry?
Although Venture Capital, on average, is not a good asset investment class, the best investors make extraordinary gains and motivate the entire sector. Thus, the feeling of a bubble, generated by high valuations may indicate that the market is in fact moving in this direction, or simply open the reality of an industry that, historically, does not generate satisfactory returns.
3. The First Quarters of 2020
Global investments in Venture Capital showed a slight drop in the first quarter of 2020, varying by region. While in China the reduction was strong, in the USA there was a slight increase.


The second quarter of 2020 positively contradicted expectations by showing a slight growth compared to the first quarter. Even so, there was a decrease in relation to the same period in 2019. This decrease was weaker than the observed in the quarters that followed the worsening of the 2008 crisis, suggesting that the current crisis will have a simple impact on investments in Venture Capital.


Regarding exits by M&A, the first quarter of 2020 was not impacted by the crisis, marked by growth in the value of the movement for acquisitions. In the second quarter of 2020, it is possible to notice a negative impact, explained by the total trading volume and the number of records, both in the YoY and QoQ comparisons.
3.3. Capital market in 2020
The stock market reflects feelings and expectations in real-time, with which we can visualize the impact of the crisis on investments. Thus, we are able to see which segments will be harmed and which will stand out in the current scenario.

The technology companies that make up the S&P 500 performed above average, generating a return of 13.5% between 2020/01/02/ and 2020/07/06. In addition, Nasdaq’s return outperformed the S&P 500 by 17.3 p.p. and Dow Jones by 24.1 p.p. in the analyzed period.
In times of crisis, most sectors are expected to retract, however, some are more resilient and end up performing better. In this case, many technology companies tend to benefit from the conditions imposed by social distance.
The chart below helps us to visualize the distribution of returns on certain assets, in 2020, based on the first day of the year. The first chart includes companies that received a Venture Capital contribution and made an IPO in 2019. The other two charts refer to the companies that make up the Emerging Cloud Index and Dow Jones.


Cloud solutions have benefited from the forced digitization process, generated by social distance. The Emerging Cloud Index includes companies that offer this type of solution, such as Zoom, Paypal, Shopify, and had one of the best performances since the beginning of the pandemic crisis. The companies in the third quartile showed a return greater than 80%, and even the first quartile showed a return above 15% in the period.
The companies in the 2019 IPO group are a good proxy for startups, since they represent the latest investments in the Venture Capital industry that have managed a public offering. But, as this group also includes companies from sectors that were severely affected by the crisis, a worse return is expected than the Emerging Cloud Index. In addition, companies in the 2019 IPO group are at greater risk than the technology giants, as they are less consolidated in the market.
The median return of companies in the 2019 IPO group was 13%, lower than the 42% of the Emerging Cloud Index, and also lower than the return of the bigger technology companies, such as Amazon and Google. However, it was significantly higher than the return of the Dow Jones, whose median was -13% in the period. Scenario reinforces the thesis that technology companies are more resilient to the current crisis.
4. Final Comments
I am publishing this article seven months after the confirmation of the first cases of COVID-19 in China. Since then, we have seen the scenario worsen around the world, contaminating more than twelve million people and causing more than five hundred thousand deaths. Today, 2020/8/7, the scenario is still very uncertain, we are not sure when the vaccine will be available, how many lives will be lost, and how long the economy will take to recover.
I am prepared for the worst, but hope for the best. (Benjamin Disraeli)
In the face of so much uncertainty, the recommendations for startups to secure cash flow and extend the runway are the most plausible. Although social distance imposed by the pandemic is more damaging to tractional businesses, most startups will suffer from reduced demand generated by unemployment and recession.
We saw that, during the 2008 crisis, the total amount invested was below the observed level before the crisis, even in 2009 and 2010. At that time, the terms were less favorable for entrepreneurs, evidenced by the increase in the number of down rounds and the decrease in the size and valuations of the investments. In the first crisis after the Great Recession, the Venture Capital industry will feel the impact of a long cycle prioritizing growth over profitability.
Until then, the 2020 data does not show a strong reduction in investments, even for late-stage startups. Likewise, the stock market is heading for a rapid recovery, in which technology companies are showing the best performance. If this increase is long-lasting, the Venture Capital market tends to benefit from liquidity, despite past crises suggesting that investments should decline in the coming months.
The pandemic exposed up inefficiencies, accelerated the digitization process, and transformed consumption habits. Some changes are temporary, while others are structural. In the post-COVID19 world, many business models will cease to exist, but there will be plenty of opportunities for a new wave of entrepreneurs willing to solve the problems that traditional players have failed. On the investor side, structural changes generate unique opportunities for returns.
References and Methodology:
[1][3] We used information from 57,814 transactions published in the USA-based startups Crunchbase between 2006 and 2019. Transactions classified between Seed and Series J were included, whose total amount invested was disclosed.
[2][5] PitchBook Analyst Note: COVID-19’s Influence on the US VC Market
[4] What’s Happening to Seed stage Venture Capital? — UP Front Ventures
[6] Secrets of Sand Hill Road, Chapter 2: So Really, What is Venture Capital? US Venture Capital Index and Selected Benchmark Statistics, US Venture Capital Achieved Respectable Double-Digit Return in 2017, PERFORMANCE OF THE PRIVATE EQUITY AND VENTURE CAPITAL INDUSTRY IN BRAZIL
[7] Outliers have been excluded from Boxplot graphics to ensure better viewing.
Other relevant materials on the subject:

