Navigating the stock market with technical analysis
Are you ready to dive into the fascinating world of stock trading?
If so, you have probably heard of technical analysis — a powerful tool that traders use to make informed buy and sell decisions.
In this article, we will break down the principles of technical analysis and offer practical tips for beginners looking to incorporate technical analysis into their trading strategies.
Understanding Technical Analysis

Technical analysis is like a roadmap for stock traders.
Instead of delving into a company’s financial statements and news — technical analysts focus on price and volume data.
They believe that historical price movements and patterns can provide valuable insights into future price movements.
The Key Principles:
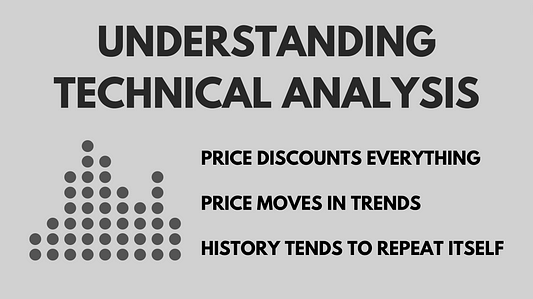
Price Discounts Everything:
The fundamental principle of technical analysis is that all available information, whether public or private, is already reflected in the stock’s price.
This means you do not need to be a financial wizard to make informed decisions.
Price Moves in Trends:
Stocks tend to move in trends, which can be upward (bullish), downward (bearish), or sideways (ranging).
Recognising these trends is crucial for successful trading.
History Tends to Repeat Itself:
Technical analysts believe that historical price patterns and trends tend to repeat themselves.
This concept forms the basis of chart analysis.
Chart Patterns
Chart patterns are the bread and butter of technical analysis.
Traders use these patterns to predict future price movements based on historical data.
Here are some common chart patterns:
Head & Shoulders:
This pattern resembles a head between two shoulders and indicates a potential reversal from an uptrend to a downtrend, or vice versa.
Double Top & Double Bottom:
These patterns suggest a reversal in the current trend.
A double top signals a potential downtrend, while a double bottom indicates an upward reversal.
Cup & Handle:
This pattern looks like a tea cup and handle and often signals a bullish continuation after a brief consolidation.
Triangles:
Triangles come in various forms, including ascending, descending, and symmetrical.
They suggest an impending price breakout, but the direction can vary.
Flags & Pennants:
These patterns are like small breaks in the price action before a trend continuation.
Flags are rectangular, while pennants are small symmetrical triangles.
Recognising these patterns can be tricky, but with practice and experience, you will become better at identifying them on stock charts.
Indicators
Indicators are tools that traders use to gain additional insights into price trends and momentum.
They are like sidekicks for chart patterns.
Here are a few common indicators:
Moving Averages:
Moving averages smooth out price data and help traders identify trends.
The two most commonly used types are simple moving averages (SMA) and exponential moving averages (EMA).
Relative Strength Index (RSI):
RSI measures the speed and change of price movements.
It is used to determine whether a stock is overbought or oversold — helping traders identify potential reversal points.
Moving Average Convergence Divergence (MACD):
MACD is both a trend-following and momentum indicator.
It consists of two moving averages and a histogram — providing valuable information about trend changes.
Bollinger Bands:
Bollinger Bands consist of a middle band (SMA) and upper and lower bands that represent volatility.
They help traders identify potential price reversals.
Using these indicators alongside chart patterns can enhance your ability to make well-informed trading decisions.
Trends
Understanding trends is a fundamental aspect of technical analysis.
Trends are categorised into three main types:
Bullish Trends:
In a bullish trend, the price is consistently rising.
Traders look for opportunities to buy during pullbacks within the trend.
Bearish Trends:
In a bearish trend, the price is consistently falling.
Traders seek opportunities to sell during temporary rallies within the trend.
Sideways Trends (Ranging):
In a sideways trend, the price moves within a horizontal range.
Traders may buy low and sell high within this range.
Identifying the current trend is essential for selecting the right trading strategy.
A common saying among traders is: ‘the trend is your friend’.
Practical Tips For Beginners
Now that you have a basic understanding of technical analysis, here are some practical tips for beginners:

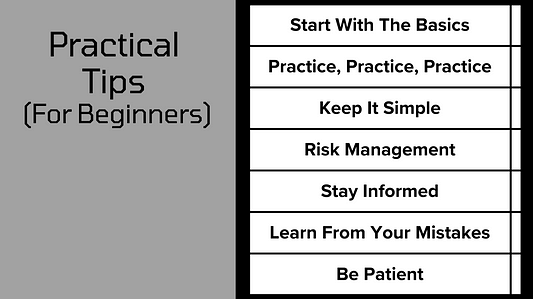
Start with the Basics:
Begin by learning the basics of chart patterns and a few key indicators.
Trying to master everything at once can be overwhelming.
Practice, Practice, Practice:
Open a demo trading account to practice your analysis without risking real money.
This helps build your confidence and skill.
Keep It Simple:
Do not overcomplicate your analysis with too many indicators or patterns.
Start with a few that you understand well.
Risk Management:
Always use stop-loss orders to limit potential losses.
Never risk more than you can afford to lose.
Stay Informed:
Keep an eye on economic and news events that could impact the markets.
Technical analysis works best when complemented with a broad understanding of the financial landscape.
Learn from Your Mistakes:
Do not be discouraged by losses. They are part of the learning process.
Analyse what went wrong and adjust your strategy accordingly.
Be Patient:
Successful trading requires patience and discipline.
Do not rush into trades without proper analysis.

In conclusion, technical analysis is a valuable tool for stock traders.
By understanding chart patterns, indicators, and trends, you can make informed decisions and increase your chances of success.
Happy trading!
If you would like to know more about finance and investing, feel free to check out the following list:
As always, if you have any other questions or thoughts, please feel free to add them to the responses section.
If you would like to stay connected, check out my website or follow me on my socials: Linkedin & Instagram.
This article is for informational purposes only. It should not be considered Financial or Legal Advice. Not all information will be accurate. Consult a financial professional before making any major financial decisions.

