When building my algorithmic research framework across 11 years of high-frequency data, I learned how easily a single line of Python can create a fake millionaire bot.
Press enter or click to view image in full size
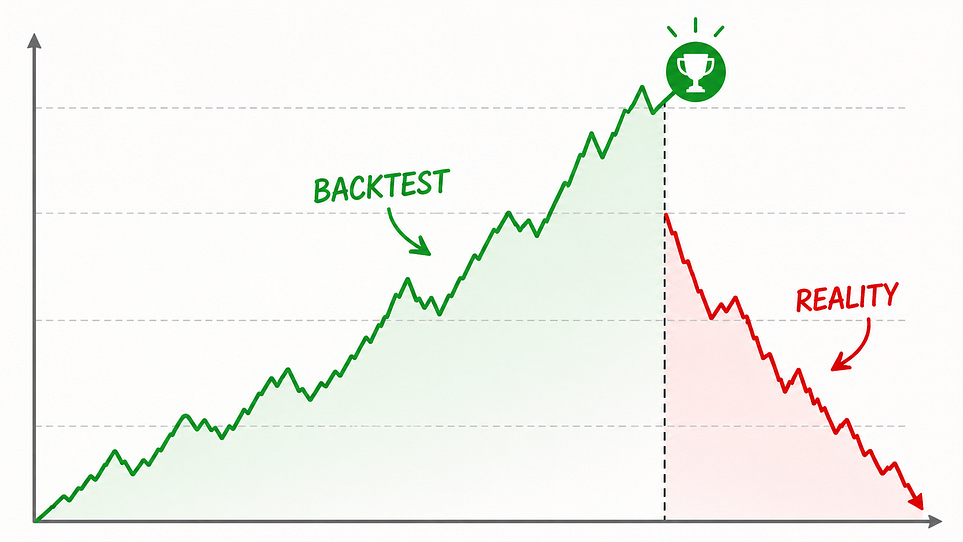
There is a dangerous phenomenon in quantitative development that I like to call “The Equity Curve Illusion.”
You spend weeks writing a custom backtesting engine from scratch. You pull high-frequency market data, implement your trade simulation logic, and write a script to evaluate a specific price action pattern. You hit execute, and your performance dashboard shows a beautiful, upward-sloping equity curve.
Your framework claims a massive win rate and an expectancy that seems to break the laws of finance. You feel like you’ve unlocked a money-printing machine.
But don’t quit your day job just yet.
Press enter or click to view image in full size
Press enter or click to view image in full size
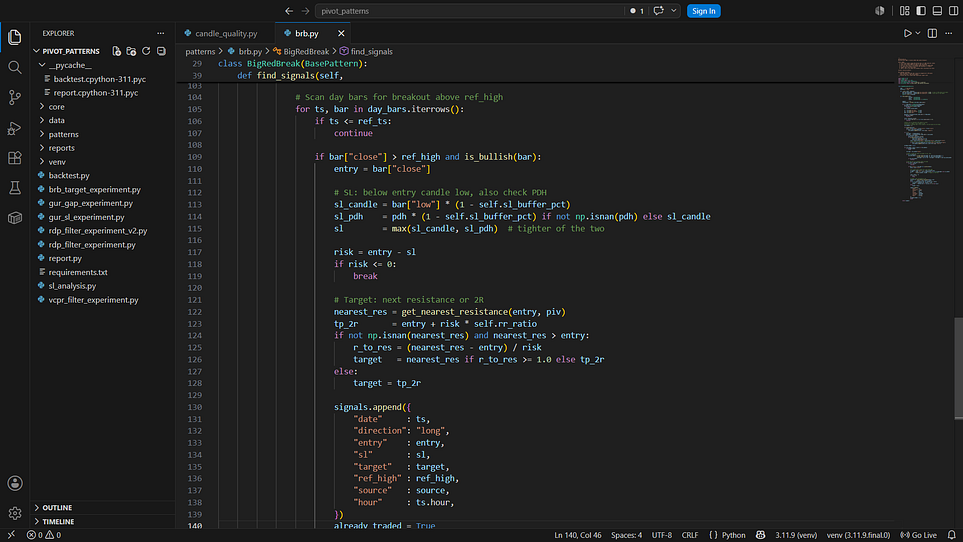
When I was building my Pivot Pattern Backtesting Framework to systematically evaluate price action across Indian equity indices (like Nifty 50 and Bank Nifty), I processed over 11 years of 5-minute OHLCV data — amounting to more than 200,000 bars per instrument. Working at that scale taught me a brutal lesson: If your backtest looks too good to be true, it’s usually a lie. The script didn’t crash. Python didn’t throw an error code. Your syntax was flawless.
Instead, you fell victim to the ultimate silent killer of quantitative models: Look-Ahead Bias (Data Leakage). Let’s pull back the curtain on how this happens in time-series code and how to build a unified architecture to prevent it.
The “Time-Travel” Bug in High-Frequency Data
Look-ahead bias occurs when your backtesting engine accidentally uses information from the future to make a trading decision in the past. In real-time live trading, you only know what has happened up to the current millisecond. In a backtest, however, the entire 11-year dataset sits neatly inside a single Pandas DataFrame.
Because the future is readily available in your computer’s memory, it is terrifyingly easy to let your code peek forward without realizing it.
When engineering daily, weekly, or monthly pivot calculators across 5-minute intervals, a common way to trigger this bias is a subtle vectorization error in Pandas.
The Vectorization Trap
Let’s say you are calculating a support level or a candlestick filter. A beginner might write a vectorized operation like this:
Python
# THE TRAP: Accidentally leaking the current day's closing data into historical calculations
df['daily_high'] = df['High'].resample('D').max()
df['pivot_signal'] = (df['Close'] > df['daily_high'].shift(1))
If your indexing or resampling logic shifts data incorrectly by even a single bar, you create a time-travel loop. If your model is executing a simulated trade on a Tuesday at 10:00 AM, but its mathematical indicators include a rolling parameter or high/low calculation that factored in Tuesday’s 3:30 PM market close, it is cheating.
It looks like a genius on your HTML performance dashboard, but when deployed to a live API, the strategy will collapse because real life doesn’t give you the daily high until the day is actually over.
How to Structuralize Against the Bias: The Modular Fix
When handling a massive volume of data bars, trying to spot look-ahead bias by manually auditing thousands of lines of chaotic script is impossible. The solution isn’t to look harder at your code; it’s to change your software architecture.
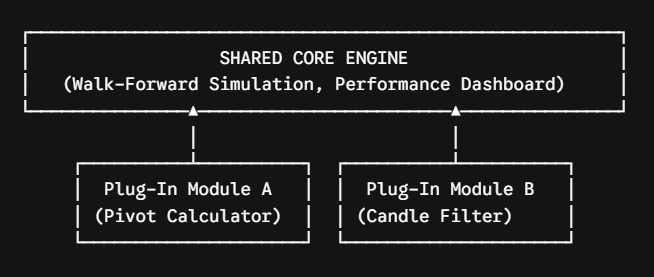
When designing my framework, I structured it as a unified Python architecture with a shared core engine and independent plug-in modules. Here is why this design pattern is a vital guardrail against backtesting lies:
1. Separate the Core Engine from the Pattern Logic
Never calculate your indicators inside the trade simulator. Your core engine should strictly handle walk-forward trade simulation, capital management, and execution tracking. It should treat each trading pattern or indicator as an isolated plug-in module.
2. Enforce Strict Interface Rules
By forcing every price action pattern to act as an independent plug-in, you can mandate that the plug-in can only read data up to bar t-1. The mathematical calculators (like daily or weekly pivots) are completely isolated from the shared trade-simulation logic.
This decoupling ensures that adding or modifying patterns can be done cleanly without touching or corrupting the shared core code. If you run a cross-pattern performance report ranked by expectancy, you can trust the results because every module is bound to the exact same strict, forward-looking data boundary.
Conclusion: Stop Chasing the Flawless Backtest
If you want to grow an audience in the quant or data science community, stop posting heavily optimized, flawless backtest results. Experienced developers and fund managers see right through them.
Instead, show your work. Write about the time you found a look-ahead bias bug that dropped your 90% win-rate pattern back down to a realistic expectancy. Document the friction of organizing 200,000+ data bars without letting the future bleed into the past.
Anyone can write a loose script that looks profitable on paper. The true craft of quantitative trading research is building a rigorous, modular framework that proves your strategy can survive the cold reality of live market data.
Follow me on Twitter/X:- https://x.com/abh_hai_
for active updates on trading and strategies.
I am Quant Trader with experience of 12 months. I am learning and growing as I document my journey and findings. I do Market data research, backtest and derive insights from data.