Quality Data, Quality Decisions: Why Web Scraping is Essential for Advanced Analytics
Gediminas Rickevičius·9 min


 Relative proportions of different causes of death across genders — filter by age[/caption]
[caption id="attachment_12597" align="aligncenter" width="1430"]
Relative proportions of different causes of death across genders — filter by age[/caption]
[caption id="attachment_12597" align="aligncenter" width="1430"] Average life expectancy at birth across provinces — filter by year[/caption]
[caption id="attachment_12598" align="aligncenter" width="1431"]
Average life expectancy at birth across provinces — filter by year[/caption]
[caption id="attachment_12598" align="aligncenter" width="1431"]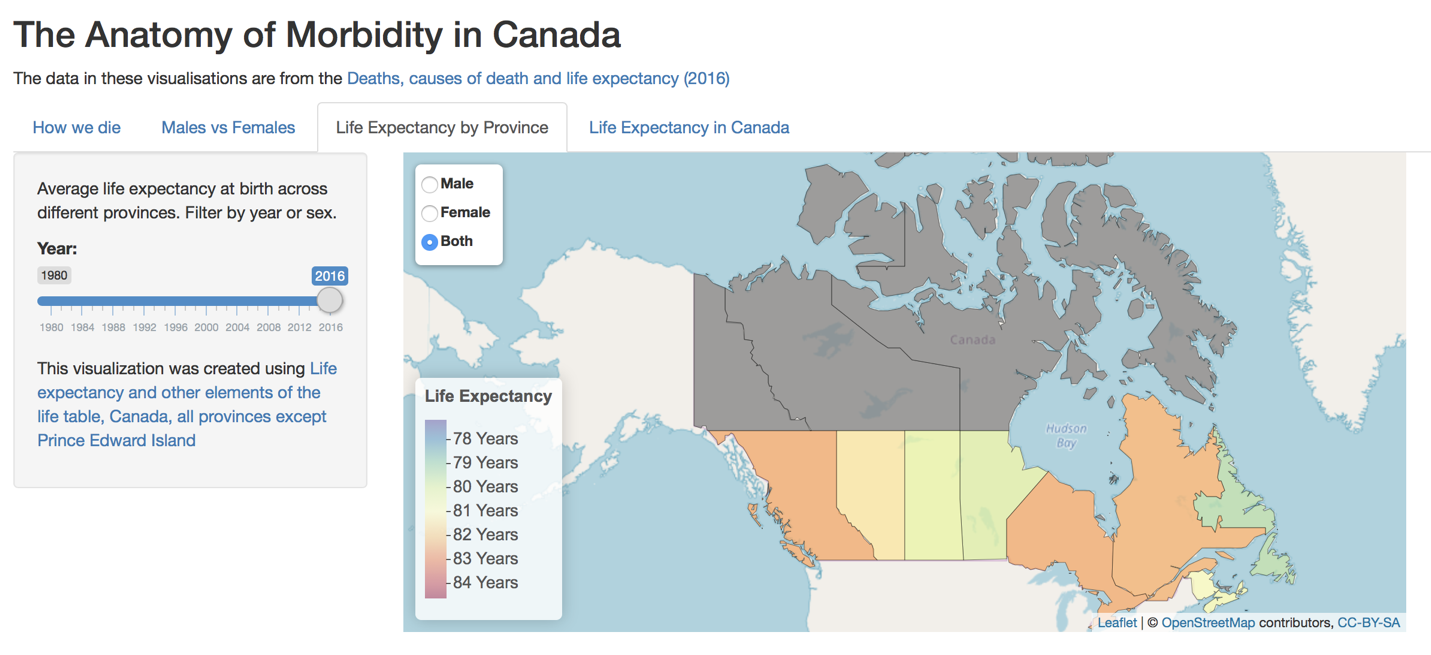 Average life expectancy at birth across provinces — filter by year or sex[/caption]
[caption id="attachment_12599" align="aligncenter" width="1868"]
Average life expectancy at birth across provinces — filter by year or sex[/caption]
[caption id="attachment_12599" align="aligncenter" width="1868"] Relative proportions of different diseases of death — filter by sex, age, or year[/caption]
[caption id="attachment_12600" align="aligncenter" width="480"]
Relative proportions of different diseases of death — filter by sex, age, or year[/caption]
[caption id="attachment_12600" align="aligncenter" width="480"] Distribution of Canadian death rates across time for each province[/caption]
[caption id="attachment_12601" align="aligncenter" width="480"]
Distribution of Canadian death rates across time for each province[/caption]
[caption id="attachment_12601" align="aligncenter" width="480"] Distribution of Canadian gender survival rates across age ranges in each province per year[/caption]
[caption id="attachment_12603" align="aligncenter" width="480"]
Distribution of Canadian gender survival rates across age ranges in each province per year[/caption]
[caption id="attachment_12603" align="aligncenter" width="480"] Live animation of Canadian male death rates across years per province[/caption]
[caption id="attachment_12604" align="aligncenter" width="480"]
Live animation of Canadian male death rates across years per province[/caption]
[caption id="attachment_12604" align="aligncenter" width="480"]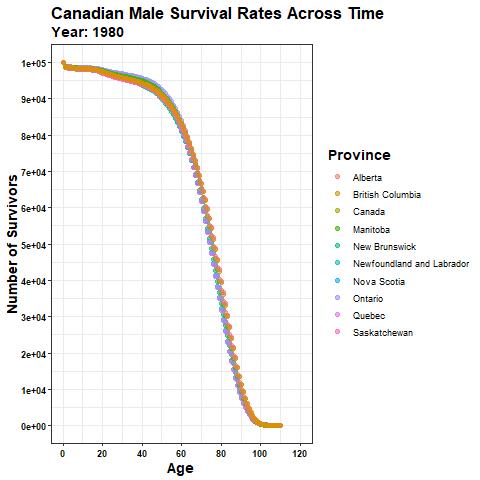 Live animation of Canadian male survival rate per province[/caption]
[caption id="attachment_12605" align="aligncenter" width="480"]
Live animation of Canadian male survival rate per province[/caption]
[caption id="attachment_12605" align="aligncenter" width="480"]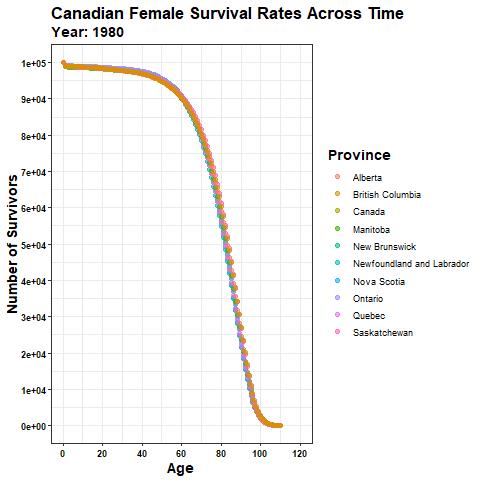 Live animation of Canadian female survival rate per province[/caption]
The full analytics workflow developed at the hackseq event can be found on our Github page and the dashboard of visualizations can be found on our shiny server. For exploring the data, you can formulate hypotheses about what we most die of as a nation and test them visually on your screen. The overall goal of our project is to elicit the interests of health care professionals and government agencies and enable evidence-informed policymaking.
Accessible, free, and open research technologies hand-in-hand with the power of community is the driving force behind this project. We hope to see more data science for good projects. If interested, please join us for 2019’s hackseq event coming up in October.
[caption id="attachment_12606" align="alignnone" width="1200"]
Live animation of Canadian female survival rate per province[/caption]
The full analytics workflow developed at the hackseq event can be found on our Github page and the dashboard of visualizations can be found on our shiny server. For exploring the data, you can formulate hypotheses about what we most die of as a nation and test them visually on your screen. The overall goal of our project is to elicit the interests of health care professionals and government agencies and enable evidence-informed policymaking.
Accessible, free, and open research technologies hand-in-hand with the power of community is the driving force behind this project. We hope to see more data science for good projects. If interested, please join us for 2019’s hackseq event coming up in October.
[caption id="attachment_12606" align="alignnone" width="1200"] Hackseq18 team — Anatomy of Morbidity project (Team members: Eva Yap, Katarina Priecelova, Shannon Lo, Rachel Miller, Mariam Arab, chuhan zhang, Emily Gong, Sophia Chan, Adil Imtiaz, Uyen Nguyen, Lisa Cao, Marion Shadbolt, Raissa Phillibert, Noushin Nabavi)[/caption]
References:
[1]. Canada’s aging population will strain the health-care system
[2]. Caring for aging parents costs Canadians $33 billion a year — and it’s just going to get worse
[3]. Canada ‘woefully unprepared’ to deal with senior population surge, Senate committee hears
[4]. Roberts, K. C. et al. “Prevalence and Patterns of Chronic Disease Multimorbidity and Associated Determinants in Canada.” Health Promotion and Chronic Disease Prevention in Canada: Research, Policy and Practice 35.6 (2015): 87–94.
Hackseq18 team — Anatomy of Morbidity project (Team members: Eva Yap, Katarina Priecelova, Shannon Lo, Rachel Miller, Mariam Arab, chuhan zhang, Emily Gong, Sophia Chan, Adil Imtiaz, Uyen Nguyen, Lisa Cao, Marion Shadbolt, Raissa Phillibert, Noushin Nabavi)[/caption]
References:
[1]. Canada’s aging population will strain the health-care system
[2]. Caring for aging parents costs Canadians $33 billion a year — and it’s just going to get worse
[3]. Canada ‘woefully unprepared’ to deal with senior population surge, Senate committee hears
[4]. Roberts, K. C. et al. “Prevalence and Patterns of Chronic Disease Multimorbidity and Associated Determinants in Canada.” Health Promotion and Chronic Disease Prevention in Canada: Research, Policy and Practice 35.6 (2015): 87–94.Noushin is a cell biologist and a data enthusiast. She earned a PhD in Systems Biology from the University of Toronto and has worked on several projects related to human health and disease since graduation. She writes articles at the intersection of education, technology, and science.