And one of them came back from the dead — after I found a bug that had been lying to me.
Press enter or click to view image in full size
Press enter or click to view image in full size
If you find this insightful then please clap 50 times and comment your views
I’ve been trading price action setups based on pivot points for a while now. Like most traders, I had a rough sense of which patterns “worked” — mostly from screen time, a few good trades, and the usual confirmation bias that comes with manually reviewing charts.
But I never actually knew if they had a statistical edge.
So I decided to find out. I built a Python backtesting framework from scratch, fed it 11 years of Nifty and BankNifty 5-minute OHLCV data (2015–2026, ~200,000 bars per instrument), and systematically tested 15 pivot-point price action patterns.
The goal wasn’t to find the best-looking backtest. It was to find patterns where the edge is real, consistent, and defensible — and to catch myself when it wasn’t.
The Framework
Each pattern is an independent plug-in that inherits from a base class. It finds signals, simulates trades bar-by-bar, and computes performance metrics — win rate, profit factor, expectancy in R-multiples, max drawdown, and equity curves.
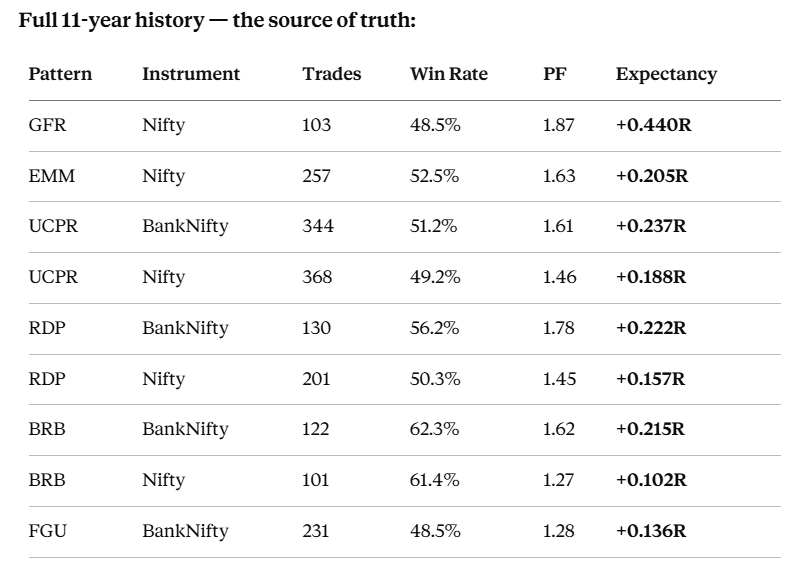
Primary validation: the full 11-year history (2015–2026). Every number in this post is the pattern’s real, live behavior across that entire window — not a curated sub-period.
Recency check: the last 4 years (2022–2026). Regimes shift. A pattern that only worked in one stretch of history isn’t an edge, it’s a coincidence with a good story. I re-ran everything on just the recent window to see what holds up under current market conditions.
I ran every pattern on both instruments independently. A pattern that works on Nifty but not BankNifty doesn’t get published for both — instrument-specific edge is real, and papering over it is how backtests turn into disappointing live results.
The SL Analysis Tool
One thing I built that changed how I read results was a stop loss continuation analysis.
When a trade hits SL, most backtests just count it as a loss and move on. But that hides something important — was the directional read wrong, or was the SL just too tight?
I built a tool that classifies every SL-hit trade into three buckets:
SL too tight — price hit SL then went on to reach the full target same day. Direction was right, SL placement was the only problem.
Partial recovery — price hit SL then recovered at least 30% of the SL-to-target distance. Some directional merit but couldn’t sustain.
Genuinely wrong — price hit SL and never looked back. The pattern’s directional read was simply incorrect.
To be clear: once SL is hit, the trade is closed and the loss is locked in. This tool doesn’t change the P&L — it’s purely diagnostic. It answers one question: was the pattern’s directional call right or wrong? That answer tells you whether to fix the SL or walk away from the pattern entirely.
This tool is also, indirectly, the reason one of my patterns nearly got published with numbers that weren’t real. More on that below.
The 15 Patterns — What Survived
Out of 15 patterns tested, 6 showed a real, mechanically-defensible edge: FGU, BRB, RDP, UCPR, EMM, GFR. The rest showed negative expectancy on at least one instrument, or were fundamentally discretionary — requiring contextual judgment that resists mechanical rule encoding. MMM (Morning Money Maker) was dropped outright — negative expectancy across every variant, no path to a mechanical edge.
Pattern 1: Failed Gap Up (FGU) — the one that needed a rebuild
Setup: Market gaps up significantly. First few 5-minute candles form a bearish rejection, with the high touching a pivot resistance level. Entry on close of that candle. SL above the resistance.
Press enter or click to view image in full size
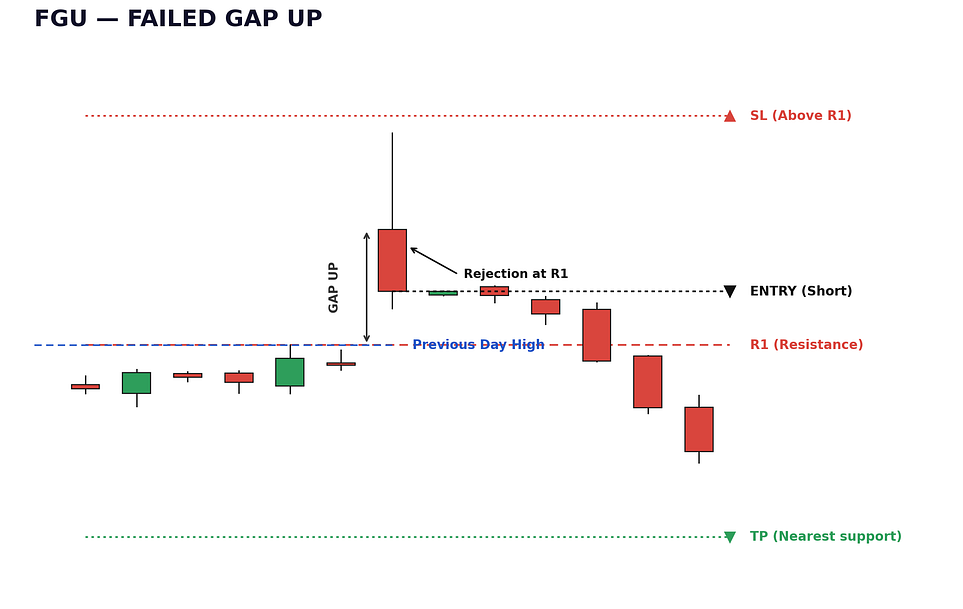
Just an illustration, actual pattern may appear differently on real chart
This pattern’s SL analysis showed something eye-catching: 45% of Nifty SL-hit trades went on to reach the full target the same day. That looked like a clear signal — the direction was right, the stop was just too tight. I ran a 7-variant SL-widening experiment to fix it.
The experiment said: don’t touch it. Widening the SL made everything worse. Baseline (tighter of pivot-based stop and a 1% hard stop) was already optimal. So I moved to gap-size filtering instead, found a threshold that looked like it improved results, and locked in numbers I was happy with: +0.224R on Nifty, +0.187R on BankNifty.
Then I ran the official, final backtest through the actual production pipeline — the one source of truth — and FGU fell apart. +0.224R became +0.023R. +0.187R became −0.013R. Trade counts matched exactly, which was the tell: the entries were identical, but the outcomes weren’t. Something in how trades were being scored, not which trades were being taken, was wrong.
I found it. My standalone experiment scripts checked “did the target hit?” before “did the SL hit?” within each 5-minute bar. Production checks SL first. That sounds like a small detail, but a single 5-minute candle can touch both levels — and there’s no way to know which one price actually hit first intrabar. The only defensible assumption is the conservative one: assume SL first. My experiments were quietly assuming the best case every time a bar touched both, silently turning real losses into recorded wins. On a pattern built around volatile rejection candles right after a gap, this happened often enough to erase most of the real edge.
I re-ran everything, properly this time, in three honest stages:
SL: re-confirmed baseline was still optimal — that conclusion held up even with the bug fixed.
Gap threshold: re-swept. The old 0.3%/0.5% split only produced +0.06R on both instruments once measured honestly. 0.7% turned out to be the real sweet spot — the same threshold on both instruments, not two different ones.
Target: even at 0.7%, production’s average R:R was only ~1.3x against a 2R target — most “wins” were partial closes at end of day, never actually reaching the target. I swept 7 target formulas using real bar-by-bar R-multiples instead of an idealized payoff model. Targeting the nearest pivot support level (instead of PDH-or-2R) won cleanly on both instruments.
With all three fixes in place, here’s what’s real:
Nifty: +0.024R. Technically positive, but with 154 trades this is inside the noise floor — a single basis point of slippage per trade would likely erase it. Not tradeable. Dropped.
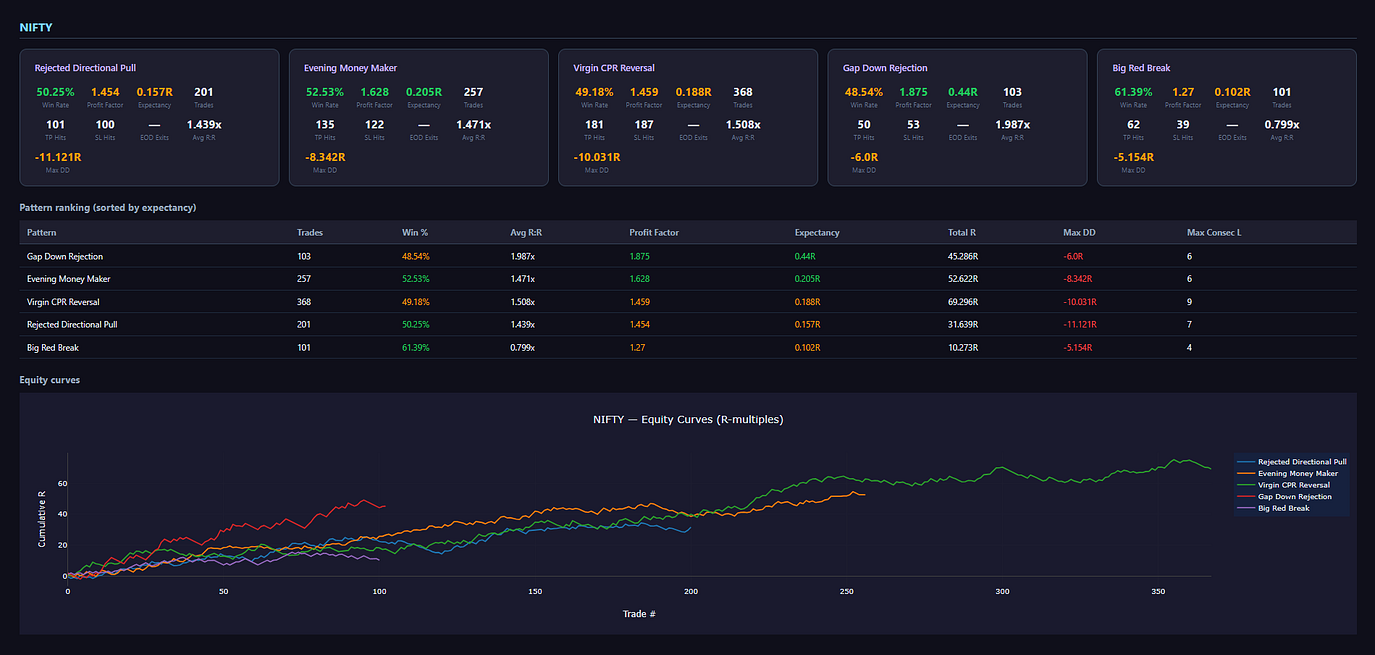
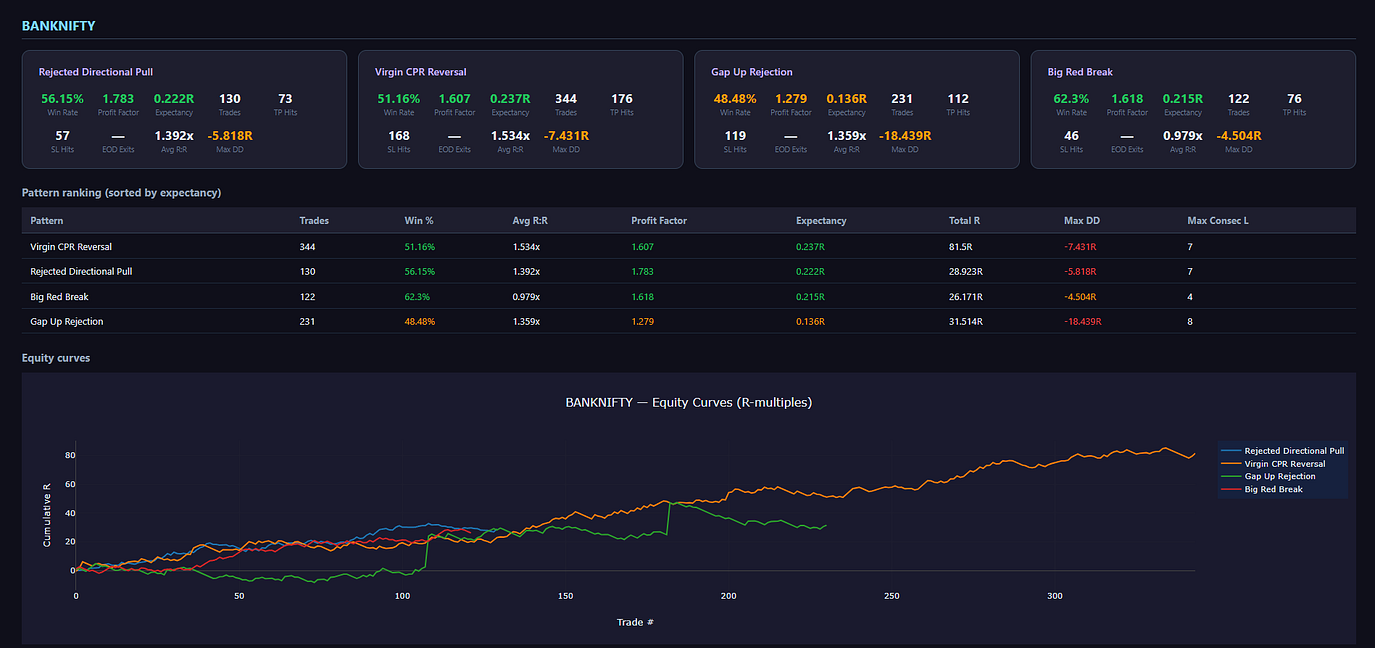
BankNifty: +0.136R, PF 1.28, WR 48.5%, 231 trades over 11 years. Real, and holds up (+0.094R) on the last 4 years too. This is the version that ships.
FGU survives — but as a BankNifty-only pattern with a rebuilt SL confirmation, a unified gap threshold, and a completely different target than where it started.
Pattern 2: Big Red Break (BRB)
Setup: The first 5-minute candle of a session is a large bearish candle. Price later breaks above the high of that candle with a bullish close. Entry on breakout candle close. SL below entry candle low or PDH. Skip if CPR is just above the breakout level.
Press enter or click to view image in full size
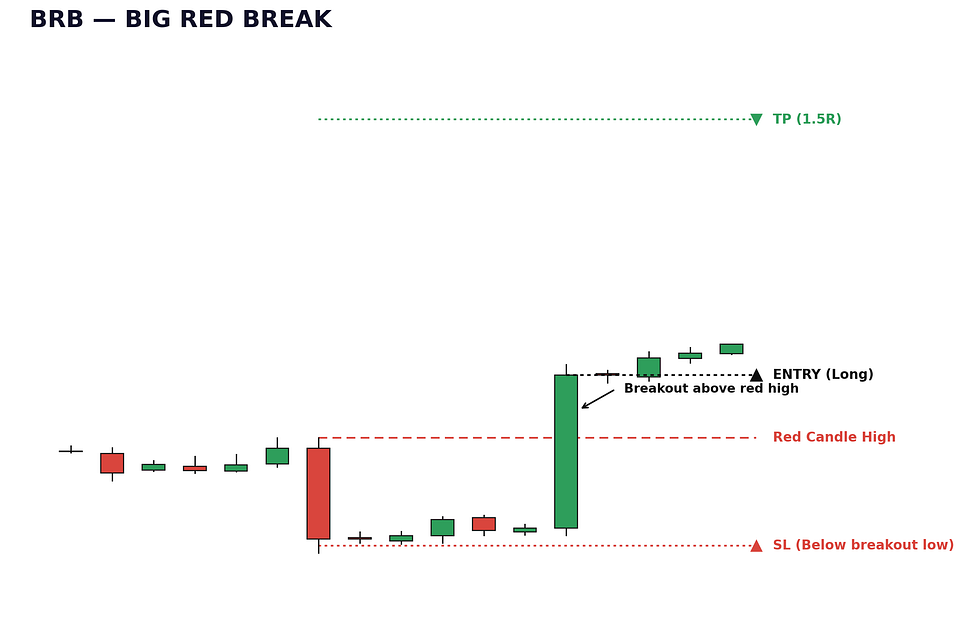
Just an illustration, actual pattern may appear differently on real chart
This pattern contains two distinct signal sources: today’s first candle, and the previous day’s first candle. Once I separated them, the picture became clear.
Today’s first candle on BankNifty: negative across every target variant, both time windows, 285 trades — large enough to be definitive. Dropped.
Previous day’s first candle: consistently positive on both instruments.
The SL analysis showed a high “partial recovery” rate — price moving the right direction after SL but unable to sustain to a 2R target. That pointed at the target being too ambitious, not the SL being wrong, so I ran a target-tightening experiment. 1R (Nifty) / 1.5R (BankNifty) came out on top.
One implementation bug surfaced here too: the code that picks between “nearest resistance” and the fixed R-target had its comparison threshold hardcoded instead of tied to the actual R-ratio in use. It was mostly harmless at the old default (2R), but once the target tightened to 1R/1.5R, it started substituting the wrong target on a meaningful chunk of trades. Fixed it to always take the closer, more achievable of the two — the same logic already used correctly elsewhere in the framework.
Final parameters (11-year / full history):
Nifty: previous-day candle only, 1R target — 101 trades, WR 61.4%, PF 1.27, +0.102R expectancy
BankNifty: previous-day candle only, 1.5R target — 122 trades, WR 62.3%, PF 1.62, +0.215R expectancy
Low frequency (~9–11 trades/year per instrument) but high conviction — and a case study in how the SL analysis tool can point you at the right fix (target, not stop) even when the pattern doesn’t need SL changes.
One honest caveat: BRB on Nifty flips negative in the last 4 years (−0.166R, 25 trades). Small sample, so I’m not calling it broken — but it’s the one pattern in this set that doesn’t hold its sign across both windows, and it deserves that disclosure rather than a quiet omission. BankNifty BRB, by contrast, is remarkably stable: +0.215R over 11 years, +0.210R over the last 4.
Pattern 3: Rejected Directional Pull (RDP)
Setup: Market gaps up. First 5-minute candle is bullish and closes into resistance. Entry when a subsequent candle closes below the first candle’s low — trapping the early longs. SL above the resistance. Target: 2R.
Press enter or click to view image in full size
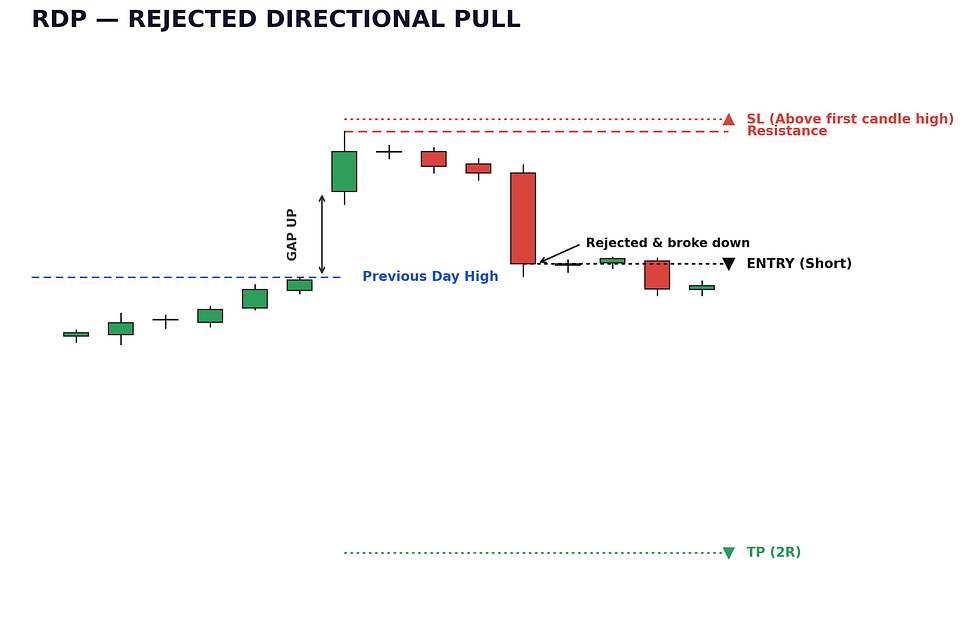
Just an illustration, actual pattern may appear differently on real chart
The SL analysis here told a very different story from FGU: 76% of Nifty SL-hit trades were genuinely wrong direction. No amount of SL tuning fixes that — the signal quality itself needed work.
I tested 4 filters: minimum gap size, first-candle body strength, close-below-CPR, and “open gaps above PDH” (a stronger gap than merely above previous close). The PDH filter won cleanly on both instruments and both time windows — when the market gaps above the previous day’s high, there’s no prior-day support below, and trapped longs have nowhere to hide.
The CPR filter actively hurt results — a good reminder that discretionary rules don’t always translate mechanically.
Final parameters (11-year / full history):
Nifty: gap opens above PDH — 201 trades, WR 50.3%, PF 1.45, +0.157R expectancy
BankNifty: gap opens above PDH — 130 trades, WR 56.2%, PF 1.78, +0.222R expectancy
Same filter, same logic, both instruments — and both hold up well in the last 4 years too (+0.130R Nifty, +0.192R BankNifty).
Pattern 4: Untested CPR Reversal (UCPR)
Setup: A CPR that no candle body has entered since it formed acts as strong support or resistance. Price approaches this untouched level, shows confirmation, and reverses.
Press enter or click to view image in full size
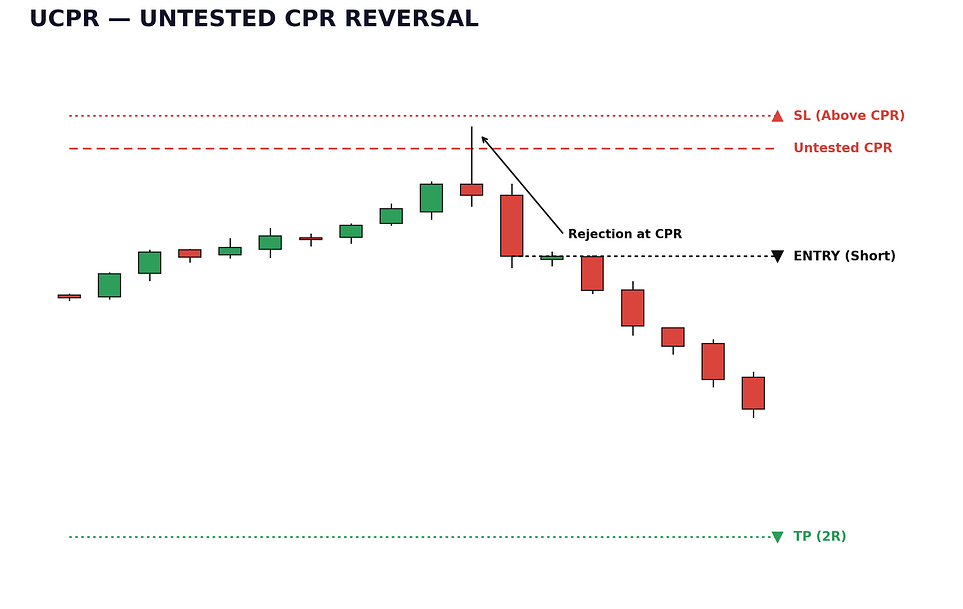
Just an illustration, actual pattern may appear differently on real chart
Running long and short sides separately revealed something the combined results had been hiding: the long side has no edge — untested CPR acting as support was negative or flat across every variant, on both instruments. It was quietly dragging down the combined numbers. The short side is where the edge lives — untested CPR as untested overhead resistance, with retail longs getting trapped on the way up.
Testing age thresholds confirmed that untested CPR levels weaken with time — age ≤3 days was the sweet spot. Restricting entries to the morning session further improved results.
Final parameters (11-year / full history), same for both instruments:
Short only, untested CPR age ≤3 days, morning entry only
Nifty: 368 trades, WR 49.2%, PF 1.46, +0.188R expectancy
BankNifty: 344 trades, WR 51.2%, PF 1.61, +0.237R expectancy
The most consistent pattern in the set — both instruments, both time windows, barely any drift.
Pattern 5: Evening Money Maker (EMM)
Setup: Market gaps up above PDH. First candle is bearish or a bearish pin bar — the euphoric gap up is immediately rejected. Entry when a candle in the first 30 minutes closes back below PDH, trapping gap-up buyers. SL above the first candle high or nearest resistance.
Press enter or click to view image in full size
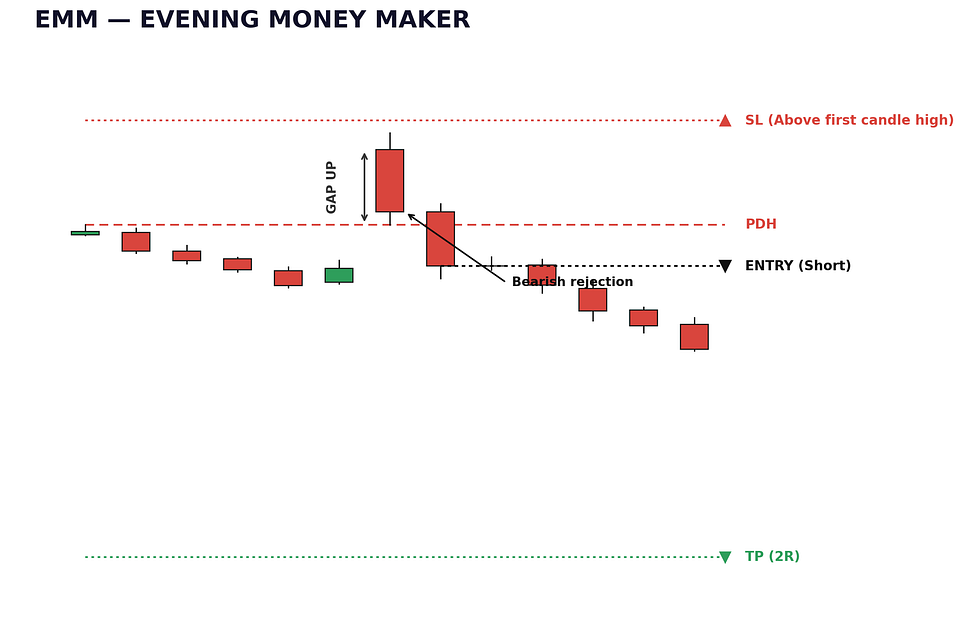
Just an illustration, actual pattern may appear differently on real chart
EMM was negative on BankNifty (−0.065R) — dropped. Nifty only.
Fourteen filter combinations were tested — gap size, entry window, SL mode. Every single one either reduced expectancy or collapsed sample size. The baseline was already optimal.
Final parameters (11-year / full history):
Nifty only, baseline unchanged — 257 trades, WR 52.5%, PF 1.63, +0.205R expectancy
Holds up in the last 4 years too (+0.121R), one of the highest win rates in the set at ~23 trades/year.
Pattern 6: Gap Failure Reversal (GFR)
Setup: Previous day bearish or closed near its low. Current day gaps down significantly. Price spends time below PDL, building a base of trapped shorts. Entry on a bullish candle closing back above PDL.
Press enter or click to view image in full size
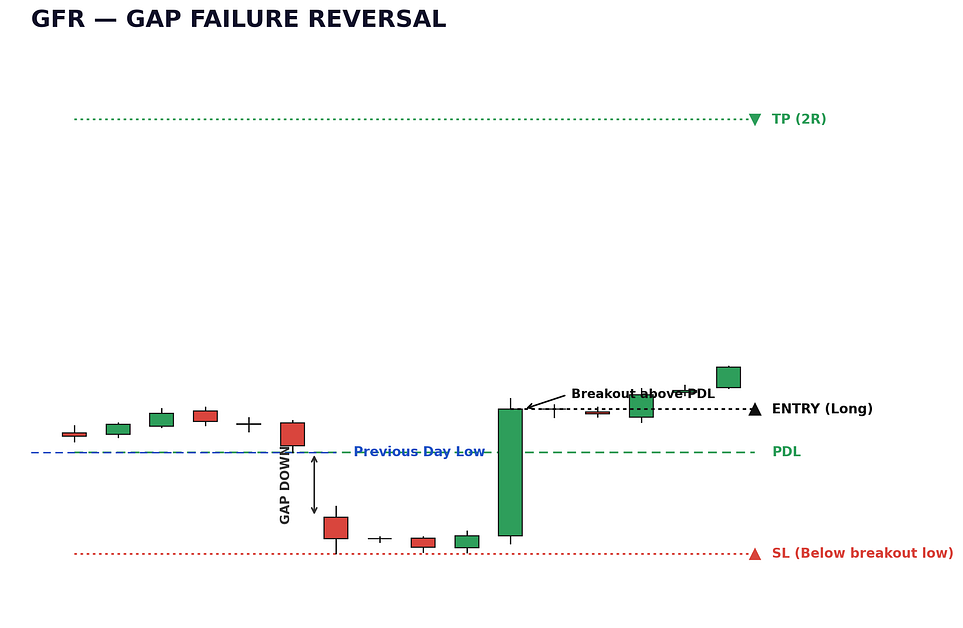
Just an illustration, actual pattern may appear differently on real chart
The rarest pattern in the set (~9 trades/year on Nifty), but the highest expectancy of all six.
BankNifty was decisively negative (−0.176R, 78 trades) — dropped.
The mechanical data contradicted the conventional short-covering wisdom here: earlier entries (hour 11–12) outperform the late-afternoon window typically favored for these setups. Every hour filter beyond 11 reduced expectancy monotonically. Like EMM, the baseline was already optimal — no filter improved on it.
Final parameters (11-year / full history):
Nifty only, baseline unchanged — 103 trades, WR 48.5%, PF 1.87, +0.440R expectancy
Low frequency, highest conviction — and the strongest holder in the recency check too (+0.286R over the last 4 years).
The Complete Picture
Press enter or click to view image in full size
Press enter or click to view image in full size
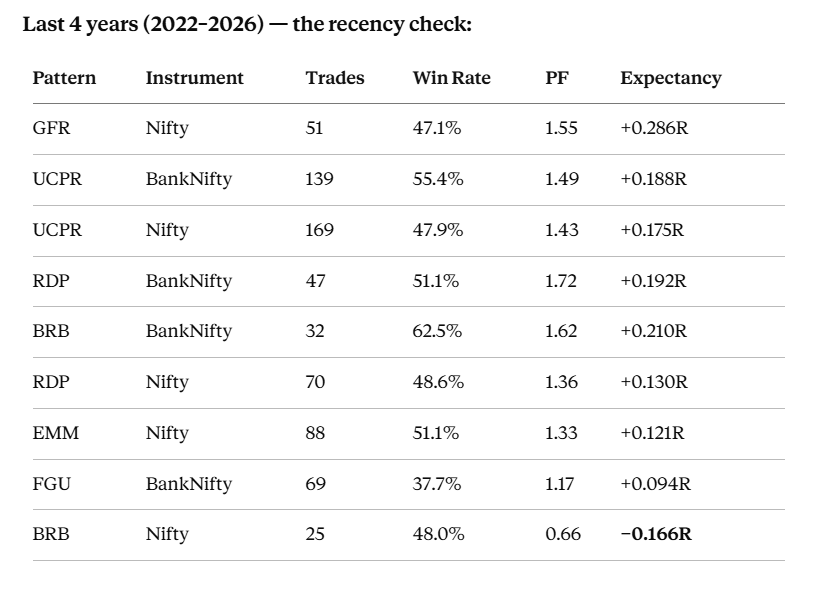
Seven of nine instrument-pattern pairs hold their sign and rough magnitude across both windows — genuinely reassuring regime-robustness. The one exception, BRB on Nifty, is flagged above rather than smoothed over.
These are mechanical baselines with zero discretion. A trader applying context — reading the day’s structure, avoiding choppy sessions — would likely improve on these numbers. This is the floor, not the ceiling.
What I Learned
Simulation methodology bugs are invisible until you cross-check against the real pipeline. FGU’s original numbers looked great and were completely wrong — not because the pattern logic was flawed, but because a standalone experiment script checked target-before-SL instead of SL-before-target. Any bar that touched both levels got silently recorded as a win. The lesson: never trust a standalone experiment’s numbers until they’re confirmed through the exact same simulator that will run in production.
Instrument-specific edge is real, and it doesn’t respect your expectations. EMM and GFR work on Nifty but not BankNifty. FGU turned out to be the reverse — it only survives on BankNifty. BRB needs different targets per instrument. There’s no shortcut here; every pattern has to be validated independently on every instrument.
Mixed signal sources corrupt results. BRB’s today-vs-previous-day candle mixing was hiding the fact that today’s BankNifty signals had no edge at all. Always check for hidden subpopulations before concluding a pattern works or doesn’t.
The SL analysis tool is a diagnostic, not a verdict. It correctly flagged that FGU’s losses often continued toward target (pointing at a possible SL fix) and that RDP’s losses were mostly genuinely wrong-direction (pointing away from any SL fix). Both diagnoses were right. What went wrong was a separate, unrelated bug in how the follow-up experiment was simulated — a good reminder that a correct diagnosis doesn’t guarantee a correct fix, and every fix needs its own honest validation.
Baselines often win. For EMM and GFR, every filter combination underperformed the original baseline. For BRB and FGU’s SL logic, the same was true. Optimization isn’t always the answer — sometimes the original rule was already capturing the edge.
Drop patterns instead of forcing them. MMM, UCPR’s long side, BankNifty EMM/GFR, and now Nifty FGU were all dropped cleanly when the honest data said no. The guiding principle throughout: fix bugs, run clean experiments, read results honestly, and drop rather than curve-fit.
What’s Next
Pine Script indicator development for TradingView publication. The six validated patterns translate into seven indicator implementations: two instrument-specific BRB variants (Nifty, BankNifty), two universal indicators that work identically on both instruments (RDP, UCPR), two Nifty-only indicators (EMM, GFR), and one BankNifty-only indicator (FGU).
Alongside that: an automated execution system built around these patterns on MT5 using MQL5.
Framework built in Python. Data: Nifty 50 and BankNifty 5-minute OHLCV, 2015–2026. Primary validation: full 11-year history. Recency check: 2022–2026.
Follow me on Twitter/X: https://x.com/abh_hai_ for active updates on trading and strategies.
I am Quant Trader with experience of 12 months. I am learning and growing as I document my journey and findings. I do Market data research, backtest and derive insights from data.