
Backtests assume you buy on the day the politician did. You can't. So I checked what happens when you buy on the day you actually find out.
Every few weeks someone sends me a screenshot of a "Congress portfolio" beating the S&P 500, usually with a caption like "just copy them." I build investing tools for a living, so I get the appeal. Members of Congress sit in closed-door briefings, they write the rules, and they have to tell us what they buy. It sounds like a free edge.
The catch is in the word "tell." Under the STOCK Act, members have to report a trade within 30 days of being notified of it, and never later than 45 days after the trade itself. Most of the charts I see quietly start the clock on the trade date, a day nobody outside that member's household could have traded on.
So I did the boring thing: I pulled the filings myself and tested the version a regular investor could actually run.
What I collected
I downloaded every electronically filed periodic transaction report (PTR) that the House Clerk published between June 2 and September 25, 2026. That's 149 filings from 67 members. I parsed each line for the trade date, the type (purchase, sale, exchange), the asset class and the ticker, then matched each filing to the date it went public in the Clerk's index.
Two caveats up front. This is the House only; I didn't include Senate filings. And scanned, handwritten filings were skipped because I can't parse them reliably, so a handful of members who still file on paper aren't in here.
Part one: how long you actually wait
Across 1,088 stock transactions from 47 members, the median gap between the trade and the day it became public was 23 days. The average was 43 days, dragged up by a long tail.
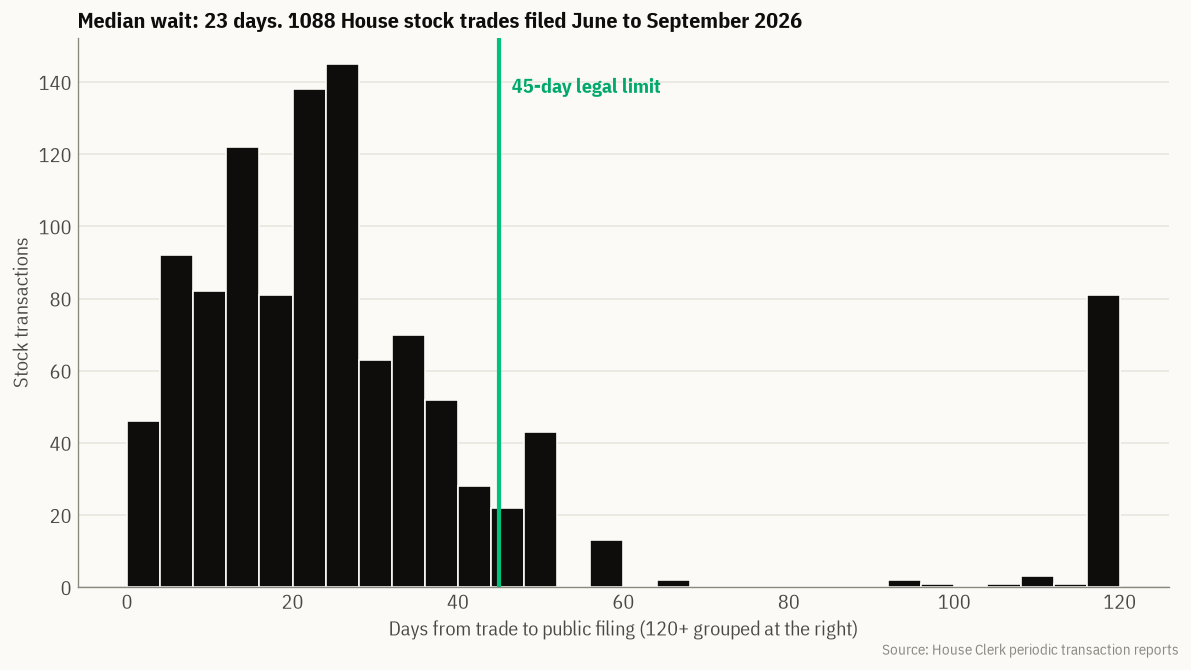
Days from trade to public filing
A few things jumped out at me:
Only about 13% of trades were public within a week.
149 transactions (14%) showed up more than 45 days after the trade date. Some of that is legitimate, since the 30-day clock runs from notification, and spouses' accounts can lag. But 81 transactions surfaced four months or more after the fact, and three were over a year old.
The late filers were concentrated. Two members accounted for 116 of the 149 late transactions.
If your idea of "following Congress" is that you see the trade and act on it, you're usually acting three weeks after the fact. In a market where a stock can move 10% on one earnings call, three weeks is a long time.
Part two: does copying the buys work?
Then I took the purchases only. Sales are harder to "copy" for most people, and many of them are trims. That left 442 stock purchases across 220 tickers from 27 members, after dropping one ticker with no price history.
For each purchase I computed two returns, both measured to the October 16, 2026 close using adjusted prices from Yahoo Finance:
Trade-date entry: buy at the close on the day the member traded. This is what most backtests do.
Disclosure entry: buy at the close of the first session after the filing went public. This is what you could actually do.
For each version I measured $SPY over the exact same dates, so the comparison is apples to apples even though the holding periods differ. Every trade got equal weight. I didn't try to size positions by the reported dollar ranges, because 387 of the 442 purchases were in the smallest bucket ($1,001 to $15,000) and the ranges are too wide to be meaningful.
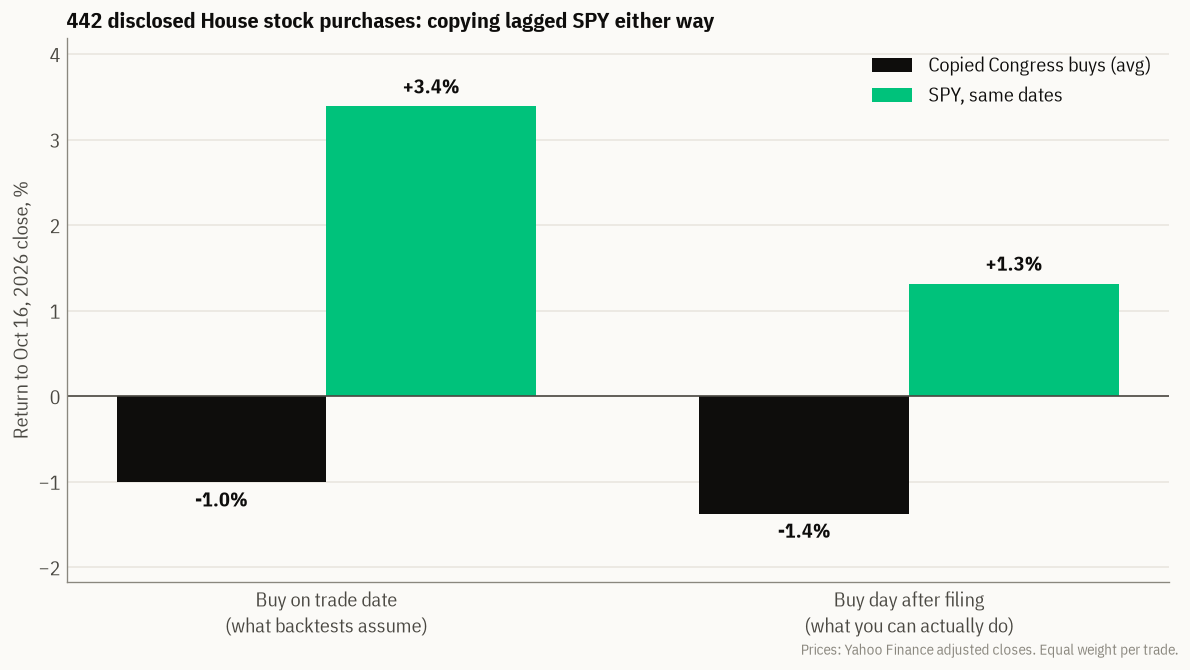
Returns of copied purchases vs SPY
Here's what came out:
Copied buys (avg) | $SPY, same dates | Difference | |
|---|---|---|---|
Buy on trade date | -1.0% | +3.4% | -4.4 pts |
Buy day after filing | -1.4% | +1.3% | -2.7 pts |
Only 37% of purchases beat $SPY from the trade date, and 40% from the disclosure date. The median purchase did worse than the average: -5.1 points versus $SPY from the trade date and -3.8 points from disclosure.
A note on timing. I first ran this to the October 9 close and refreshed it to October 16. In that one week $SPY slipped and several of the biggest Congress winners gave back a lot, so both sides moved down. The gap to $SPY barely changed (-4.4 and -2.6 points before, -4.4 and -2.7 now), which is the part I care about.
The part that surprised me: in this sample, the lag didn't hurt copycats. It slightly helped. Between the trade date and the disclosure date, the stocks Congress bought trailed $SPY by 1.75 points on average. Copiers who came in late skipped part of that underperformance.
I tried a few ways to break my own result:
One very active filer made 152 of the 442 purchases. Removing that member made things worse, not better: -5.3 points from the trade date and -2.5 from disclosure.
Weighting each member equally instead of each trade changes the picture. The trade-date version came in at -1.7 points, and the disclosure version at roughly +0.5 points. That's essentially flat, and it hinges on a few members with only a handful of trades each.
Only the larger purchases ($15,001 and up, 55 trades) still lagged $SPY in both versions: -4.7 points from the trade date and -3.1 from disclosure.
The winners were real. Two $ACN buys, $RVTY, $W and $CRWD beat $SPY by roughly 50 to 70 points from the trade date. But they were outnumbered by quieter losers, and an equal-weight copier owns all of them.
What I think this means
I want to be careful here, because this is a small, short window and I don't want to replace one overconfident chart with another.
What this test can't tell you:
It covers roughly four months of filings and returns measured over weeks to months, not years. A different stretch of 2026 could look completely different. Even one week moved the raw returns by a couple of points.
House only. The Senate, and any member who files on paper, aren't here.
Equal weight per trade isn't how anyone actually invests, and the member mix drives the result. A few prolific traders shape the average.
No trading costs, no taxes, no slippage. Those would only make copying look worse.
Survivorship: one ticker had no price data and was dropped.
What I'm comfortable saying:
The disclosure lag is real and it's usually longer than people think: three weeks at the median, with a meaningful tail beyond the 45-day limit.
In this sample, the lag wasn't the main problem. The picks themselves, taken as a whole, didn't beat a plain index fund. Most of the "Congress beats the market" charts I see concentrate on a few famous names or start the clock on a date you couldn't trade.
A list of what politicians bought isn't a strategy on its own. If there's an edge, it's probably in which members, which trades (size, timing, committee relevance), and what you do while you wait. All of that needs testing, not screenshots.
That last point is why I'm not telling anyone to stop watching these filings. I still read them. A $500K buy from someone on the relevant committee is information. A thousand-dollar buy of a mega-cap in a spouse's IRA mostly isn't. The job is telling those two apart, then being honest about whether acting on them beats just owning the index.
How I'd test this yourself
If you want to run your own version, here's what I'd keep:
Enter on the disclosure date, never the trade date. Use the first close after the filing is public.
Benchmark every trade against the index over the same window. A stock that went up 3% while $SPY went up 5% didn't make you money in any useful sense.
Report the median and the hit rate, not just the average. A few big winners can hide a lot of losers.
Paper trade it first. Run it forward for a few months before risking money, because the backtest is always the most flattering version.
That last one is the reason I built a paper-trading agent. If you want to run your own Congress-following rules forward without real money, you can try it on a paper milo agent.
I'll rerun this as more filings come in and see whether the result holds over a longer window. If someone has a cleaner Senate dataset for the same period, I'd love to compare.
Disclosure: I'm the founder of milo, an AI investing agent. For stocks it's a research and paper-trading tool. Nothing here is investment advice.
Data: House Clerk periodic transaction reports filed June 2 to September 25, 2026 (https://disclosures-clerk.house.gov/FinancialDisclosure). Prices: adjusted daily closes from Yahoo Finance through October 16, 2026. Returns are equal-weighted per transaction and exclude costs. Reporting deadlines: STOCK Act of 2012 (periodic transaction report rules).
Moti Cohen is the founder of milo. LinkedIn

Founder of milo, an AI investing research agent. I write data-driven pieces for regular stock investors. This one tests copying 442 House members' stock purchases against SPY using the real disclosure lag, all from public House filings and Yahoo prices. Draft: https://medium.com/@pumpparade/i-tried-copying-congresss-stock-trades-with-the-real-disclosure-lag-a4a659f213c2