Six years building models that moved billions. And I still almost made the mistake every data-heavy founder makes.

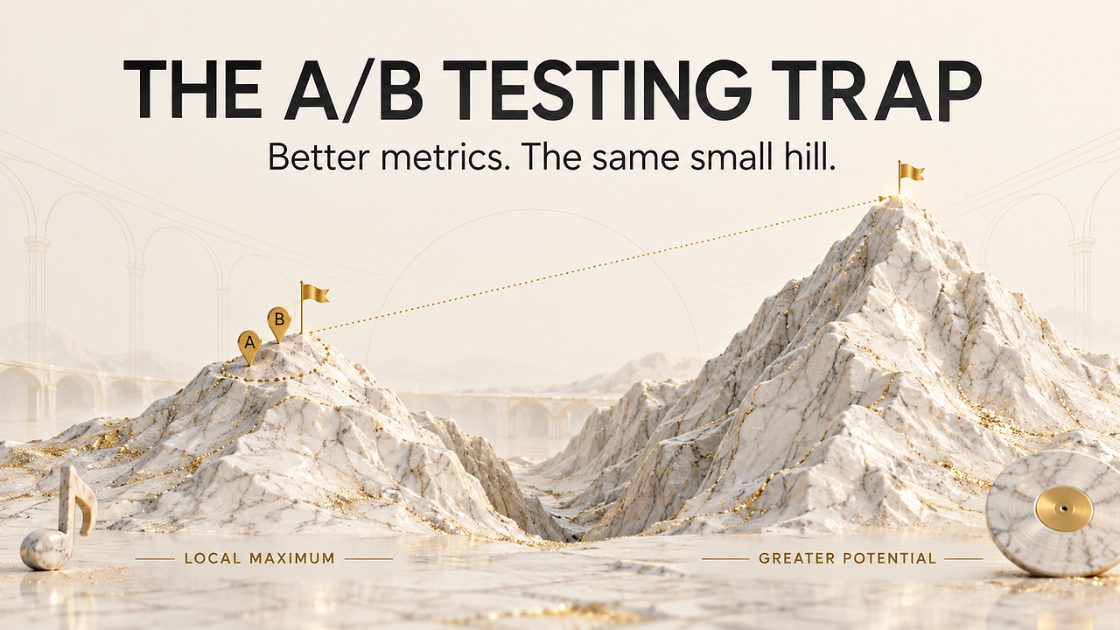
Small wins can keep a product on the same hill. AI-generated illustration.
I almost made the same mistake every data-heavy founder makes:
I confused optimizing a metric with building a product worth using.
Despite my six years as a data science consultant for various consulting firms (Deloitte, Booz Allen, Accenture) and my years running my own AI company (Echonos), I still almost made this rookie mistake.
Understanding the difference between optimizing a metric and building a product customers want to use is like a model deciding whether the optimized value is a local or global maximum. Or a hiker settling for a high peak instead of scaling the whole mountain.
There’s no guarantee that the optimized metric translates to customer growth. In The Lean Startup, Eric Ries argues that vanity metrics make you feel good short-term, but do not guide action long-term. Real numbers such as downloads, page views, and registered users look good by themselves, but they do not always tell the full story of whether a product is worth using.
A local maximum for a model’s cost function (or minimum, depending on the function) is similar. It looks good, but it may not be the best possible outcome overall. It’s a narrow detail that doesn’t take everything else into account.
Even as a founder with a data background, I do find myself falling for real signals and correct model outputs that capture a narrow picture. In reality, I should be asking better questions based on these signals.
What a Local Maximum Actually Is (and Why A/B Tests Love Them)
A/B testing is popular for getting quick customer feedback and responses on different UI designs. They are structurally designed to compare adjacent variants as opposed to distant ones.
On the flip side, that design makes them perfect instruments for finding local maxima.
Andrew Chen, a General Partner at a16z, described his own hard lesson on Substack (May 28 2024):
In my twenties as a feral young founder, I erred towards relying on data too much. But I found that often took me to local maxima. For zero-to-one situations, there is an argument to just be ignorant of the quantitative data, and instead just train on intuition.
Chen sharpens the point further on his personal site:
A/B testing is a recipe for mediocrity if it becomes the primary product-decision tool. Testing one feature at a time is likely to lead to a crappy product.
If Version B of a product beats Version A of a product, that doesn’t necessarily mean that Version B is the superior design. Chen argued that narrowing the frame to independent features per test does little to improve the overall product. Evaluating a trail for the highest mountain based on a half-mile stretch doesn’t mean you’ve evaluated the full two-mile stretch.
The Quibi Problem: When Vanity Metrics Mask Terminal Retention
Quibi launched in April 2020 and saw 1.7 million downloads in its first week. That number felt like signal, when it was noise.
According to Failory (October 2020), daily active users dropped 90% within three months. Furthermore, fewer than 10% of free trial users converted to paid subscriptions.
No one on Quibi ran a public beta before investors committed $1.75 billion to the platform. Yet, investors assumed the 1.7 million downloads was enough to determine a successful product.
The product had optimized for an adjacent metric, one that was genuinely impressive compared to nearby alternatives. Yet, downloads were the local maximum/false signal. Retention, the actual metric worth investigating/global maximum, went unmeasured.
The download metric was accurate, but the question the Quibi CEO asked was wrong. By the time Quibi realized that, it was too late.
Don’t get me wrong. Download metrics aren’t useless. They do help in showing customer engagement. At a different stage with a different question, they are essential
The problem is treating download metrics as the only metric to argue for product growth. Quibi treated a distribution metric as a product-health metric.
The Vine Problem: Data That Shows Cost, Not Value
We saw Quibi as a product that was seen as having massive growth, when it didn’t. On the flip side, Vine was seen as a dud when metrics showed it could have shown rapid product growth.
Vine definitely had substantial costs, so the revenue couldn’t keep up. Infrastructure, moderation, and engineering headcount showed real numbers that could make the company too expensive to run. Twitter’s internal data correctly identified Vine as a cost center
What the data could not capture was the creator supply Vine had seeded. Logan Paul, David Dobrik, and Lele Pons all built their initial audiences on Vine. The data failed to account for the active user growth of these influencers, and how they were the ones driving Vine to be a popular product.
When Twitter shut it down in 2016, Instagram and TikTok captured that creator flywheel for zero dollars.
Jens-Fabian Goetzmann, frames the structural failure clearly in his Medium post (May 26, 2019):
The local maximum problem means that if you are A/B testing an innovative solution against a control experience that is somewhat optimized, the innovative solution may fail the test despite having higher potential. You get stuck at a local maximum.
Data-driven simplification can destroy embedded optionality the metrics cannot see. The cost center reading was accurate, yes. But it answered the wrong question.
The Correlation Trap: Why Your Activation Metric Is Probably Wrong
Many startups follow a similar pattern.
Discover an activation step
Confirm via data that users with high retention take it
Run A/B tests forcing new users through it
And yet, retention does not improve.
Andrew Chen explains why:
It turns out high-intent users do X and then become high-intent. It is correlation, not causation.
The activation behavior was a symptom of prior intent, not the cause of subsequent retention.

Prior intent can influence both activation and retention. AI-generated illustration.
Jesse Caesar confirms this in his piece for First Round Review (February 29 2024).
If you want to know what your target is doing or how much, go for quantitative research.
But if you want to know why they are doing it, qualitative research gets you that depth. Data without insight is deadweight.
At Echonos, we faced a decision where our metrics pointed clearly in one direction, but my operator read of what users actually needed pointed the other way.
Once we went with the read, the metrics caught up.
Counterposition, where this thesis breaks
Despite my argument, there are valid rebuttals to my claim.
A/B testing is how mature companies improve
That is true at scale.
Andrew Chen maps this across three stages: data-ignorant at zero-to-one, data-informed through product-market fit and early scale, data-driven at a mature product with large traffic. Applying Stage 3 tools to Stage 1 problems is the error.
You cannot A/B test your way to product-market fit because the test optimizes a known behavior. Discovery requires a different instrument.
Most founders who ignored data failed, and the ones who did not are survivorship bias.
This is a valid point. Even though I went with gut instead of metrics at Echonos, I am not claiming that intuition outperforms data as a general rule.
Kevin Systrom observed that within Burbn’s first 100 users, photos showed unusual enthusiasm. He stripped the entire product to that single behavior.
Furthermore, data decisions improved qualitative behavioral observations. Consider these two successful scenarios from these two companies.
Facebook acquired Instagram for $1 billion in 2012. Now, Instagram as a standalone entity is valued between $100 billion and upwards of $300 billion.
Slack originally started as an online multiplayer browser game called Glitch in 2009. After realizing there was no product-market fit, the team pivoted to their only successful product: a custom internal chat system to coordinate their own game development across time zones. Slack rebranded as a standalone chat tool in 2014 and was later acquired by Salesforce for $27.7 billion.
The distinction is which kind of data you use and when.
A data science background is exactly the credential for trusting models more.
Six years of consulting taught me the opposite. Every model reflects the biases of its training data. Early-stage users who tolerate your current friction are not a representative sample of the market you are trying to build.
That being said, the model is right about what those users need. This is an important metric to observe.
However, it can be wrong about everything else. Startup Genome (3,200-startup dataset) found that 74% of high-growth internet startups fail due to premature scaling, and 93% of prematurely scaled startups never break $100,000 per month in revenue.
This goes back to my point about why narrowing down the product-market fit question to one singular metric is misleading.
The Framework: Data-Informed vs. Data-Driven (and When Each Applies)
Andrew Chen’s three-stage framework is the most useful organizing principle I have found for this problem.
Stage 1: zero-to-one, operate as data-ignorant; train on intuition and qualitative observation of real user behavior.
Stage 2: product-market fit through early scale; become data-informed; let behavioral signals guide pivots and prioritization.
Stage 3: mature product with high traffic, go data-driven; run A/B tests and optimize known behaviors with confidence.

Product analytics platforms like Mixpanel, Amplitude, and PostHog are genuinely useful instruments at the right stage. But these Stage 3 tools are being used to address Stage 1 problems. As I mentioned earlier, applying Stage 3 tools too early produces optimized local maxima with high confidence.
If your data is generated by users who tolerate your current friction, it reflects what the tolerant minority accepts. It is not reflective of what the broader market needs.
The metric is accurate, yet it is based on the wrong sample.
Closing
The local maximum is not a failed measurement. The data was right. The A/B test ran correctly. The metric moved in the intended direction.
The problem was the question. A mountain two miles over never appears in a test comparing two adjacent variants.
Six years of building models that moved billions of dollars taught me to trust the signal. Founding taught me to ask whether the signal is pointing at the mountain or at the nearest hill.
Most of the time in the early stages, the signals were pointing to the hill.
Syed Ali, Founder and CEO, Echonos
Syed Ali is cofounder of Echonos, an audio-aware AI music video pipeline for indie artists, managers, and small labels. He was previously COO at Tabler and a data science consultant at Deloitte, Booz Allen Hamilton, and Accenture. He writes about the economics of music release at the intersection of streaming, AI tooling, and indie artist strategy.
Sources
Andrew Chen. Why it’s so hard to be data-driven. https://andrewchen.substack.com/p/why-its-so-hard-to-be-data-driven
Andrew Chen. Does A/B testing lead to crappy products? https://andrewchen.com/does-ab-testing-lead-to-crappy-products/
Jens-Fabian Goetzmann. The A/B Testing Trap. https://jefago.medium.com/the-a-b-testing-trap-72527c871f8a
Startup Genome. A Deep Dive Into the Anatomy of Premature Scaling. https://startupgenome.com/insights/a-deep-dive-into-the-anatomy-of-premature-scaling
Failory. Quibi Cemetery. https://www.failory.com/cemetery/quibi
Startup Archive. How Kevin Systrom pivoted Burbn into Instagram. https://www.startuparchive.org/p/how-kevin-systrom-pivoted-a-failed-check-in-app-into-instagram
Jesse Caesar, First Round Review. Why Qualitative Market Research Belongs in Your Startup Toolkit. https://review.firstround.com/why-qualitative-market-research-belongs-in-your-startup-toolkit-and-how-to-wield-it-effectively/
Frequently Asked Questions
What is a local maximum in product development?
A local maximum is when a product metric looks optimized but represents only a narrow improvement that doesn't guarantee overall customer growth or long-term success. It's like a hiker settling for a high peak instead of scaling the whole mountain—good in isolation, but not the best possible outcome.
Why do A/B tests lead to local maxima?
A/B tests are structurally designed to compare adjacent variants rather than distant ones, making them excellent at finding incremental improvements but poor at discovering breakthrough changes. Testing one feature at a time often leads to a mediocre product because it doesn't evaluate the overall user experience.
What's the difference between optimizing a metric and building a product customers want?
Optimizing a metric focuses on improving specific numbers like page views or downloads, which can be vanity metrics that feel good short-term but don't reflect whether a product is actually worth using. Building a product customers want requires asking better questions about what signals mean for real customer growth and retention.
What are vanity metrics and why are they misleading?
Vanity metrics like downloads, page views, and registered users look impressive but don't tell the full story of product value or customer satisfaction. According to The Lean Startup, they make you feel good short-term but don't guide meaningful long-term action.
How can data-driven founders avoid getting stuck at a local maximum?
Instead of relying solely on A/B testing and narrow metrics, founders should use data as input for asking better strategic questions and balance quantitative signals with intuition, especially in zero-to-one product situations. This prevents being trapped by incremental improvements that don't serve overall product excellence.
What did Andrew Chen say about data-driven decision making?
Chen warned that relying too heavily on data early in his career led him to local maxima, and he argued that A/B testing as a primary product-decision tool creates mediocrity. For zero-to-one situations, he suggests training intuition alongside quantitative data rather than being purely data-driven.
I am Ali, the Founder & CEO of Echonos, the AI music video generator for artists. I am not here to argue whether AI music is good, or whether the people making it are artists. I'm here to analyze the music industry as a whole and how AI changes the music landscape in terms of video/music production, marketing, and copyright. Prev. COO at Tabler App (1M+ users, exit) + data science consultant at Deloitte. Below is a sample draft I want to publish through Data Driven Investor https://medium.com/@syed_ali/a-music-streaming-platform-penalized-ai-music-why-artists-should-worry-6a8f46a2abd5