Quality Data, Quality Decisions: Why Web Scraping is Essential for Advanced Analytics
Gediminas Rickevičius·9 min


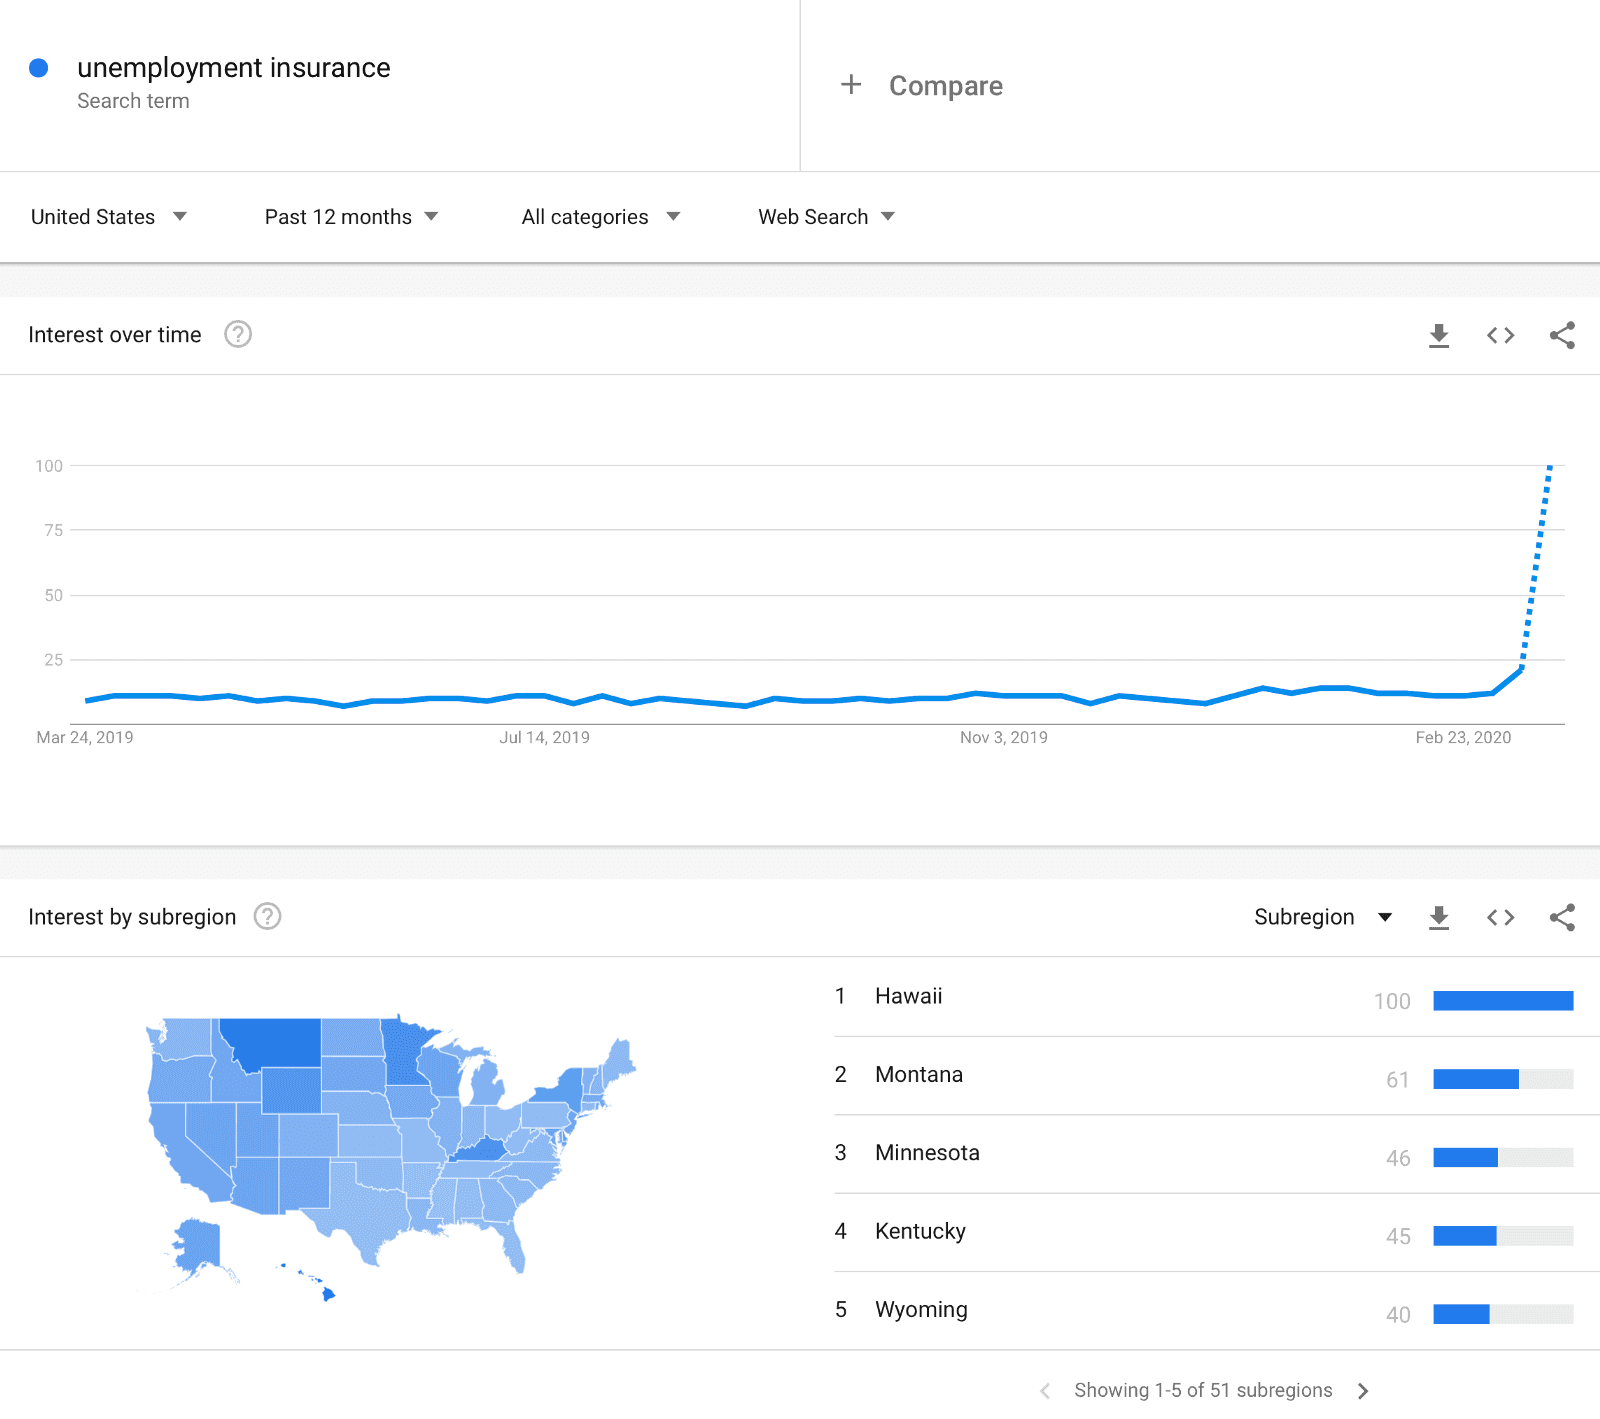 Figure 1: Example of Google Trends Website[/caption]
As can be clearly seen from the above screenshot, search trends are breaking out. It would be nice if that could be literally transformed into a predictor of Initial Claims, but Google do a lot of processing on the data they release — it is far from “raw” data — and so we need to use an algorithm to relate it to real metrics of the economy.
[caption id="attachment_19044" align="aligncenter" width="1732"]
Figure 1: Example of Google Trends Website[/caption]
As can be clearly seen from the above screenshot, search trends are breaking out. It would be nice if that could be literally transformed into a predictor of Initial Claims, but Google do a lot of processing on the data they release — it is far from “raw” data — and so we need to use an algorithm to relate it to real metrics of the economy.
[caption id="attachment_19044" align="aligncenter" width="1732"]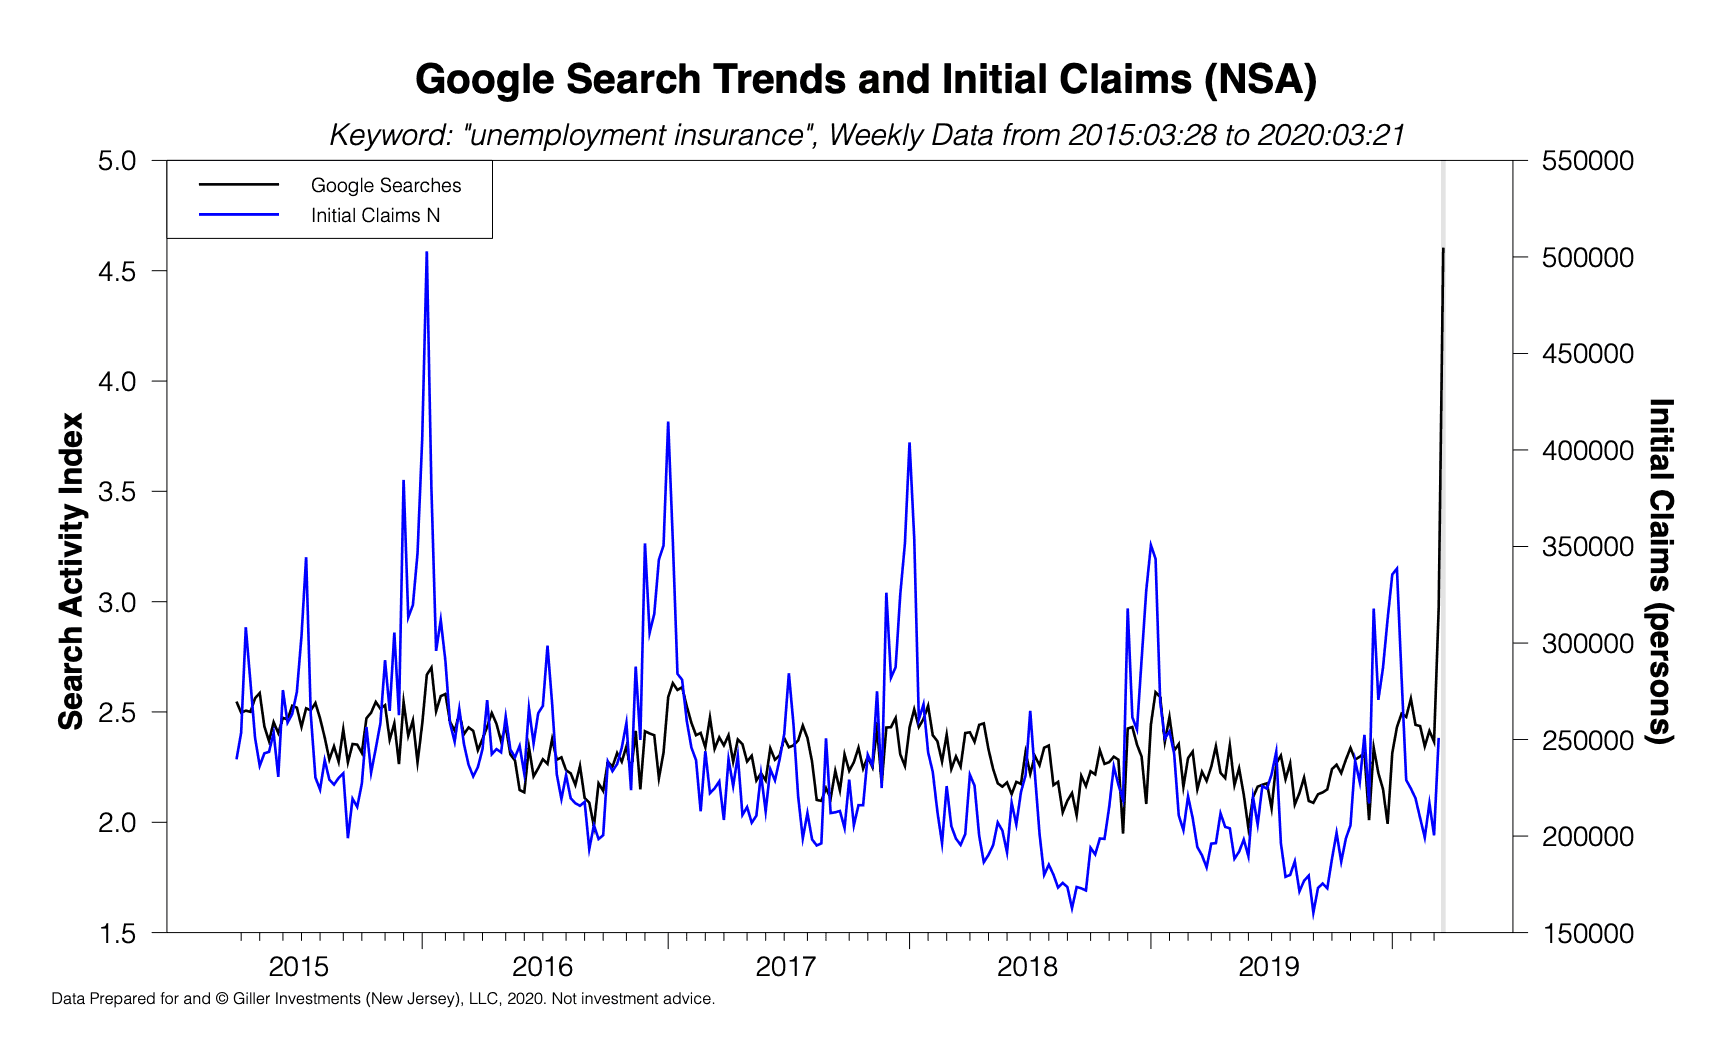 Figure 2: Key: Black = Google Trends data for keyword “unemployment insurance“; Blue = Weekly Initial Claims data (NSA)[/caption]
The simplest “algorithm” is linear regression, but in my experience that rarely does a good job on macroeconomic data because the relationships between variables tends to shift through time (the relationships are non-stationary). For example, using ordinary least squares on the above data gives a prediction of 407,350 for the most recently released data (for the week ending 03/14/2020) when the released datum was 250,892. This is a massive error!
Instead of linear regression, I tend to implement predictor-corrector machine learning algorithms. These are models that assume that there is a useful relationship between variables but that relationship tends to evolve through time. The algorithm starts off making naive predictions (it usually starts off by assuming the initial relationship is that this period’s data should equal the prior period’s data — technically this is known as a “Martingale” model) but observes its own errors through time and learns how to correct them. This is very similar to the way a child might learn how to predict the trajectory of a ball in flight so that they can catch it (without having to learn calculus and Newton’s laws of motion).
[caption id="attachment_19046" align="aligncenter" width="1732"]
Figure 2: Key: Black = Google Trends data for keyword “unemployment insurance“; Blue = Weekly Initial Claims data (NSA)[/caption]
The simplest “algorithm” is linear regression, but in my experience that rarely does a good job on macroeconomic data because the relationships between variables tends to shift through time (the relationships are non-stationary). For example, using ordinary least squares on the above data gives a prediction of 407,350 for the most recently released data (for the week ending 03/14/2020) when the released datum was 250,892. This is a massive error!
Instead of linear regression, I tend to implement predictor-corrector machine learning algorithms. These are models that assume that there is a useful relationship between variables but that relationship tends to evolve through time. The algorithm starts off making naive predictions (it usually starts off by assuming the initial relationship is that this period’s data should equal the prior period’s data — technically this is known as a “Martingale” model) but observes its own errors through time and learns how to correct them. This is very similar to the way a child might learn how to predict the trajectory of a ball in flight so that they can catch it (without having to learn calculus and Newton’s laws of motion).
[caption id="attachment_19046" align="aligncenter" width="1732"]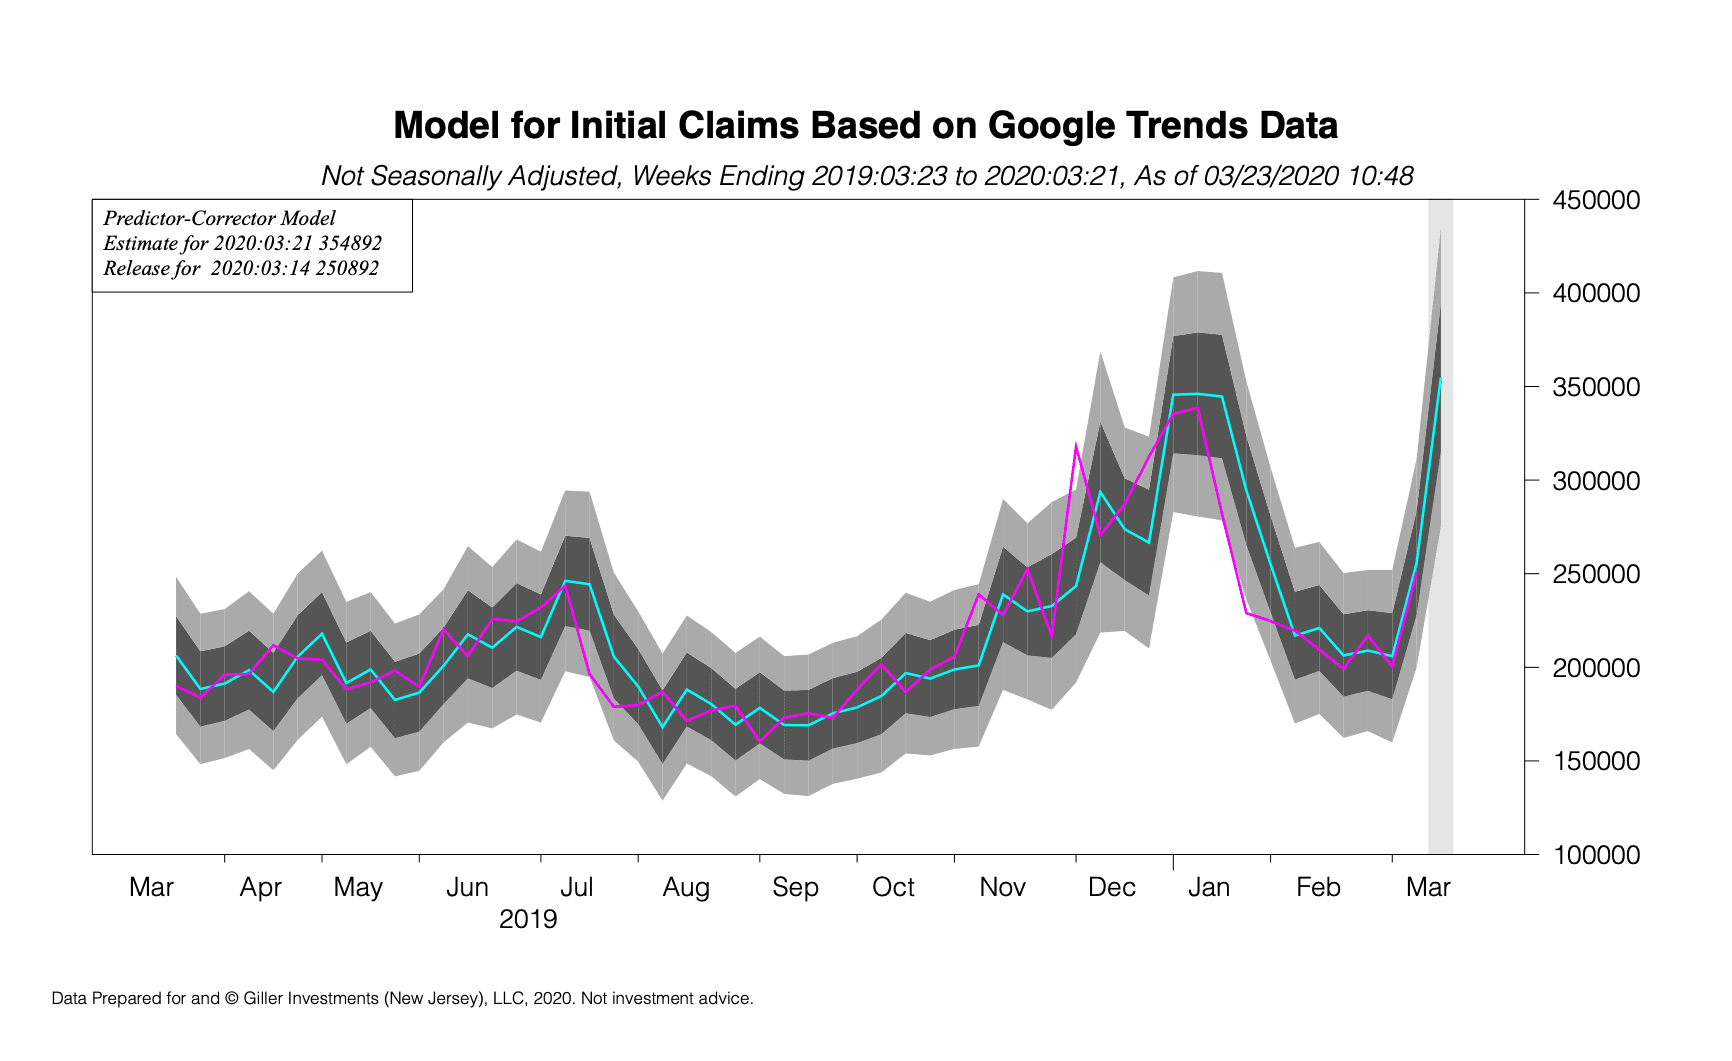 Figure 3: Key: blue curve = machine learning model; pink curve = official released data; dark grey = 68% confidence region about prediction; light grey = 95% confidence region about prediction; vertical band indicates periods with unreleased official data.[/caption]
Using this kind of model gives a much better prediction, and for last week’s release we had 241,589. I always accompany my predictions with a confidence region, because there is always uncertainty in forecasting and the right approach is to quantify that uncertainty, and the prediction lies well within the confidence region for the history presented.
I have set up automated procedures to run this model and hope to be able to publish its results on an ongoing basis on AWS Data Exchange for a small fee.
Figure 3: Key: blue curve = machine learning model; pink curve = official released data; dark grey = 68% confidence region about prediction; light grey = 95% confidence region about prediction; vertical band indicates periods with unreleased official data.[/caption]
Using this kind of model gives a much better prediction, and for last week’s release we had 241,589. I always accompany my predictions with a confidence region, because there is always uncertainty in forecasting and the right approach is to quantify that uncertainty, and the prediction lies well within the confidence region for the history presented.
I have set up automated procedures to run this model and hope to be able to publish its results on an ongoing basis on AWS Data Exchange for a small fee.Graham is Chief Executive Officer of Giller Investments (New Jersey), LLC, a financial research services firm he founded. Prior to July, 2019, he was Head of Primary Research at Deutsche Bank AG and before that Head of Data Science Research at JP Morgan. He has held Chief Data Scientist roles at Bloomberg LP and JP Morgan. Graham is an Experimental Elementary Particle Physicist by training, with a Doctorate from Oxford University, and has been living and working in the US since 1996, when he was an early member Peter Muller’s Process Driven Trading unit (PDT) at Morgan Stanley and where he was head of Futures modeling and trading. At Morgan Stanley he was the first proprietary trader risk-managed under the “value-at-risk” framework and he developed mathematical models of optimal trading algorithms. At Bloomberg he participated in many senior level meetings including giving Mike Bloomberg a tutorial on Causality Analysis in time-series data and his team did the work to bring social media data like #nfpguesses onto the terminal. From 2000 to 2008 he ran a “friends and family” private investment fund.